(T2108 measures the percentage of stocks trading above their respective 40-day moving averages [DMAs]. It helps to identify extremes in market sentiment that are likely to reverse. To learn more about it, see my T2108 Resource Page. You can follow real-time T2108 commentary on twitter using the #T2108 hashtag. T2108-related trades and other trades are occasionally posted on twitter using the #120trade hashtag. T2107 measures the percentage of stocks trading above their respective 200DMAs)
T2108 Status: 59.6%
T2107 Status: 30.0%
VIX Status: 16.7
General (Short-term) Trading Call: MILDLY bearish
Active T2108 periods: Day #14 over 20%, Day #13 over 30%, Day #13 over 40%, Day #11 over 50%, Day #1 under 60% (ending 4 days above 60%, including intraday high of 69.6%), Day #328 under 70%
Reference Charts (click for view of last 6 months from Stockcharts.com):
S&P 500 or SPY
SDS (ProShares UltraShort S&P500)
U.S. Dollar Index (volatility index)
EEM (iShares MSCI Emerging Markets)
VIX (volatility index)
VXX (iPath S&P 500 VIX Short-Term Futures ETN)
EWG (iShares MSCI Germany Index Fund)
CAT (Caterpillar).
IBB (iShares Nasdaq Biotechnology).
Commentary
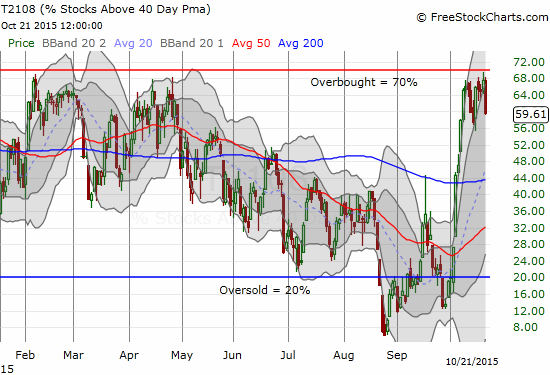
With the August Angst at an “official” end, the bears/sellers are clearly getting more restless. My favorite technical indicator, T2108, brushed right by overbought conditions on Tuesday, October 20th with an intraday high of 69.6%. I am thinking of rounding this to 70% and calling it overbought based on the definitive pullback from overbought conditions the following day.

T2108 teases the boundary marking overbought conditions: close enough?
While the S&P 500 (SPY) declined right along T2108, it was only a 0.6% loss. Having T2108 allows me to see a greater danger in the current (short-term) trading conditions. I am thinking a test of 50DMA support is now a lot more likely to happen before a test of resistance at the 200DMA. Note the rapidly rising 20DMA in the chart below that could provide additional support on a dip.


Leave A Comment