
T2108 Status: 18.1% (as high as 19.4%)
T2107 Status: 15.3%
VIX Status: 22.4
General (Short-term) Trading Call: bullish
Active T2108 periods: Day #15 under 20%, Day #18 under 30%, Day #34 under 40%, Day #38 below 50%, Day #53 under 60%, Day #394 under 70%
Commentary
“Full bull” is a term I used to apply to stocks that I targeted for aggressively bullish trading. I think I can also apply it to Facebook (FB) which happens to have a very relevant ticker symbol.

Facebook (FB) soars 15.5% to close just below a new all-time high.
FB is now a poster child for “full bull” because it easily survived its test of support at its 200-day moving average (DMA) and followed that up with a stellar post-earnings performance. A fresh all-time high would have earned the triple crown. With 107.4M shares trading hands – a whopping 4x the current 3-month average – buyers have returned in force, and I expect all this momentum to lead to more all-time highs in the near future. This will be a stock to aggressively buy on the dips for swing trades.
Ironically, FB was my last standing short (hedge) for this oversold period. I used the recent selling to eliminate all the other shorts and hedges. I made a very bad execution error by failing to grab some call options to protect against just this kind of move. However, recognizing the bullishness of this move, I immediately loaded up on call options soon after the post-earnings open. To my surprise, they all sold at their price targets before the close of trading (they were $109 and $110 calls expiring next Friday).
While the sparks were flying in FB trading, the S&P 500 spent the day churning in a very tight range that aligns with the tight range now in place for a fifth straight trading day.
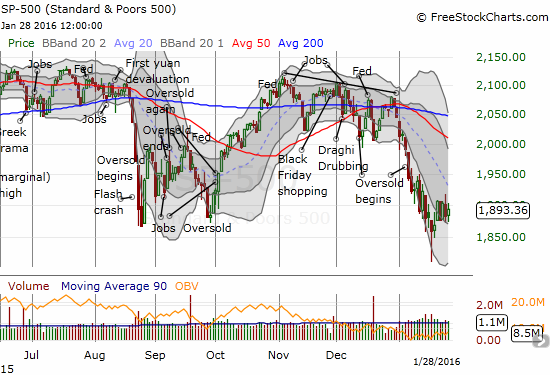
The S&P 500 (SPY) is standing still after a very hectic bottom last week.
Only T2108, the percentage of stocks trading above their respective 40-day moving averages (DMAs), reveals that action is simmering under the surface. The first 30 minutes of the trading day, T2108 rocketed right to the edge of the oversold threshold (20%). It quickly collapsed from there into the gap created by the open before pulling off a steady recovery into the close. The contours of this move matched the trading in the S&P 500. It was a quick tease peering over the edge of the oversold period. This oversold period has lasted 15 days. This duration puts this oversold period in the “historic” category. Since 1987, only FIVE oversold periods have lasted longer.


Leave A Comment