(T2108 measures the percentage of stocks trading above their respective 40-day moving averages [DMAs]. It helps to identify extremes in market sentiment that are likely to reverse. To learn more about it, see my T2108 Resource Page. You can follow real-time T2108 commentary on twitter using the #T2108 hashtag. T2108-related trades and other trades are occasionally posted on twitter using the #120trade hashtag. T2107 measures the percentage of stocks trading above their respective 200DMAs)
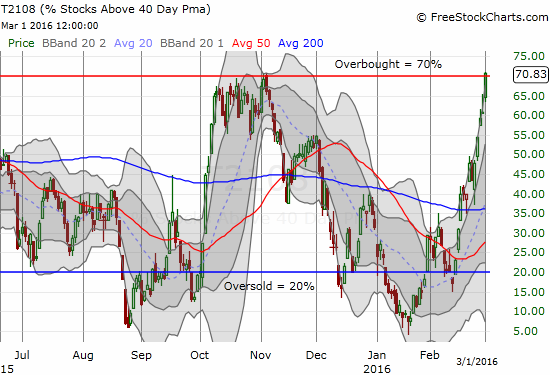
T2108 Status: 70.8% (overbought for the first time in 414 trading days!)
T2107 Status: 28.1% (new high for 2016)
VIX Status: 17.7 (cracked below 200DMA)
General (Short-term) Trading Call: bullish
Active T2108 periods: Day #11 over 20%, Day #10 over 30%, Day #7 over 40%, Day #4 over 50%, Day #2 over 60% (only spent the first day in the 60s! Ended 72 days under 60%), Day #1 over 70% (ending a record-beating 414 days under 70%!!!) (overbought)
Commentary
FINALLY. %stocks>40DMA is above overbought threshold (70%). It has been over 400 trading days since the last overnight CLOSE. #T2108 $SPY
— Dr. Duru (@DrDuru) March 1, 2016

T2108 barely breaks through the threshold of overbought conditions at 70%.
To be exact, T2108, the percentage of stocks trading above their respective 40-day moving averages (DMAs), went 414 trading days avoiding a close in overbought territory. T2108 just barely closed above the overbought threshold with a 70.8% finish.
As a reminder, here is the context for this historic 70% underperiod…

S&P 500 Price Change By Duration Below the T2108 70% Threshold
T2108 last closed above overbought territory way back on July 3, 2014. From that day to today, the S&P 500 (SPY), amazingly enough, has stayed the same: a -0.3% change. This zero move is exactly what I would expect based on the history above. This performance also means that a trader could have beaten the market by selling the S&P 500 when T2108 dropped from overbought status and then accumulating only during oversold periods. Of course, that investment chain has the great benefit of hindsight. Note that the steady decline in T2108 from the last all-time high in May, 2015 was an increasingly loud warning even as the S&P 500 churned in a tight (but widening) range until the breakdown of the August angst. For example, see my T2108 Update from August 5, 2015 titled “The “Fleckenstein Indicator” Flashes Bright Red.”


Leave A Comment