(T2108 measures the percentage of stocks trading above their respective 40-day moving averages [DMAs]. It helps to identify extremes in market sentiment that are likely to reverse. To learn more about it, see my T2108 Resource Page. You can follow real-time T2108 commentary on twitter using the #T2108 hashtag. T2108-related trades and other trades are occasionally posted on twitter using the #120trade hashtag. T2107 measures the percentage of stocks trading above their respective 200DMAs)
T2108 Status: 65.0% (near 6-month high)
T2107 Status: 29.4% (6-week high)
VIX Status: 17.4
General (Short-term) Trading Call: Neutral (target of 1996 on the S&P 500 has already occurred ahead of overbought conditions. See “From the Edge of A Breakout to the Ledge of A Breakdown” for more details).
Active T2108 periods: Day #5 over 20%, Day #4 over 30%, Day #4 over 40%, Day #2 over 50%, Day #1 over 60% (ending 113 days under 60%), Day #319 under 70%
Reference Charts (click for view of last 6 months from Stockcharts.com):
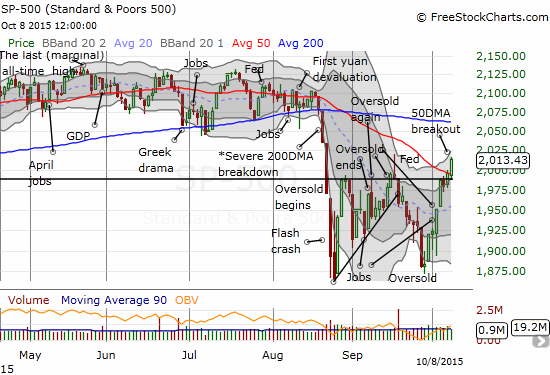
S&P 500 or SPY
SDS (ProShares UltraShort S&P500)
U.S. Dollar Index (volatility index)
EEM (iShares MSCI Emerging Markets)
VIX (volatility index)
VXX (iPath S&P 500 VIX Short-Term Futures ETN)
EWG (iShares MSCI Germany Index Fund)
CAT (Caterpillar).
IBB (iShares Nasdaq Biotechnology).
Commentary
The bullish tidings continue.
T2108 continued its startlingly fast run-up toward overbought conditions with a close at 65.0%. T2108 is on pace to hit overbought conditions on Friday, October 9, 2015. If not then, next week looks like a slam dunk. T2108 was last at current levels when the S&P 500 (SPY) was still making new all-time highs back in April. Today, Thursday, the S&P 500 managed to push through resistance at its 50DMA and is challenging the intraday high from September. This high neatly divided two oversold periods.

The S&P 500 breaks out above its 50DMA for the first time in two months


Leave A Comment