
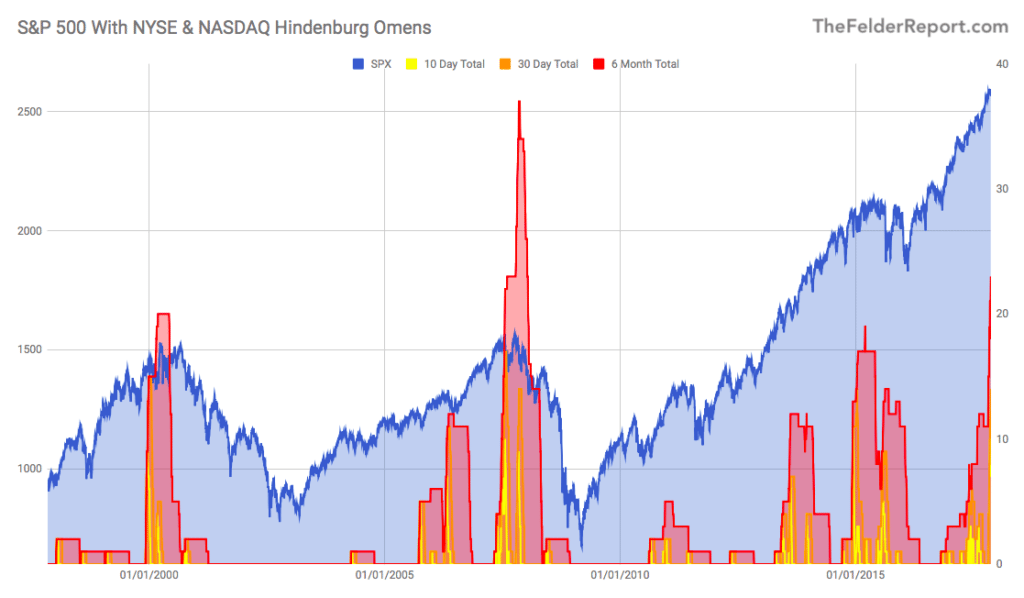
A few weeks ago I wrote “stock market breadth is much worse than this popular measure indicated” referring to the advance/decline line and how its strength masked technical erosion going on under the surface of the indexes. Since then breadth hasn’t improved. In fact, it’s gotten worse.
The “Hindenburg Omen” was developed by Jim Miekka as a warning of a stock market crash. While it’s not very effective in this regard it can be very useful in assessing the overall strength of an uptrend.
Recently, there have been a number of these omens triggered on both the NYSE and the Nasdaq. This is really due to the fact that while the indexes and many of their components have been hitting new highs, an equally large number of components have been hitting new lows, as well. This is the sort of persistent dispersion that is the hallmark of a major market peak.
The chart below shows a running total of these omens on various time frames along with the S&P 500. And it’s pretty apparent that when these flames start rising like they are today, it’s time to start worrying about the stock market.


Leave A Comment