
How well are typical American households faring so far in 2017?
To answer that question, we’re going to turn to a unique measure of the well-being of a nation’s people called the national dividend. The national dividend is an alternative way to measure of the economic well being of a nation’s people that is primarily based upon the value of the things that they choose to consume in their households, which makes it very different and by some accounts, a more effective measure than the more common measures that focus upon income or expenditures throughout the entire economy, like GDP, which have proven to not be well suited for the task of assessing the economic welfare of the people themselves.
In our case, we’ve developed the national dividend concept that had been originally conceived by Irving Fisher back in 1906, but which fell by the wayside in the years that followed because of the challenge of collecting the kind of consumption data needed to make it a reality. That kind of data exists today, which is why we’ve been able to bring it back to life.
With that introduction now out of the way, let’s update the U.S.’ national dividend through the end of April 2017 following our previous snapshot through the end of 2016.

In the first four months of 2017, we see that in nominal terms, the national dividend has risen strongly following a lackluster 2016. That observation holds after adjusting for inflation, which suggests that the typical American household is benefiting from real growth.
You can see that perhaps better with our calculation of the year over year growth rates for the nominal and inflation-adjusted national dividend, which we show in the following chart from January 2001 through April 2017.
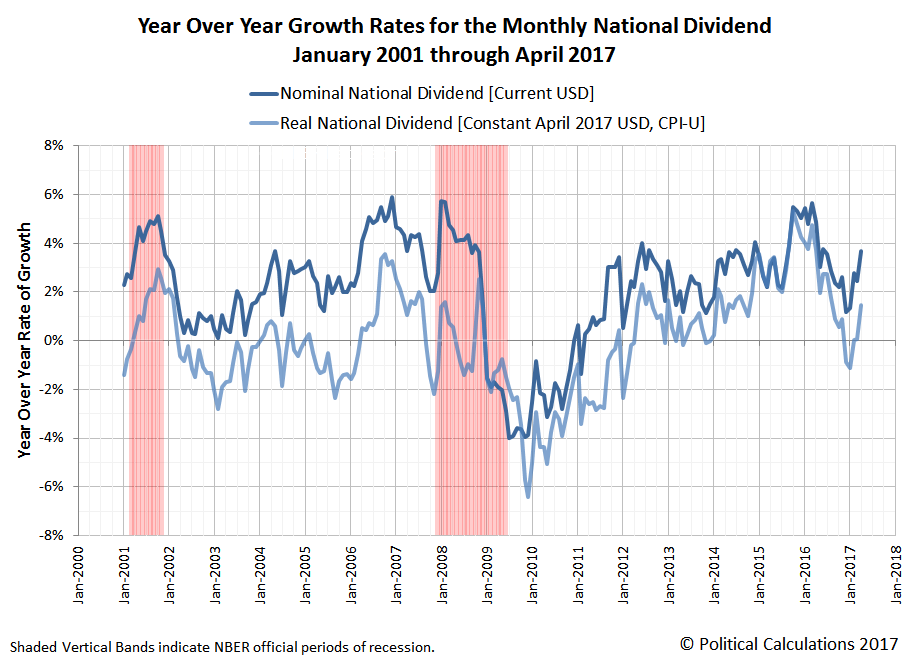
Year to date, the upward trend for 2017 appears to be much better than the previous downward trend through 2016 was.


Leave A Comment