The data always matters.
Two weeks ago, the markets were swayed by more talk of a trade war with China. I should clarify by saying that the stock market was shaken, since the Treasury bond market reaction was fairly tempered.
By Tuesday, most of the losses were recouped, and stocks were higher on Wednesday and again on Thursday.
More saber-rattling over trade wars fueled a 2%-plus selloff to close out the week. Like many of my colleagues, I’m starting to get tired of the non-stop market volatility.
And yet it continues.
Last week started with an FBI raid on President Trump’s personal lawyer’s office. Wednesday, Trump tweeted about a possible attack on Syria in response to its government’s alleged chemical attack on its own citizens – and the stock market faltered again.
It was all was forgotten by Thursday, as stocks surged once more. Stocks were comfortably in the green at the end of last week.
All of this “risk on, risk off” back and forth is enough to make your head spin!
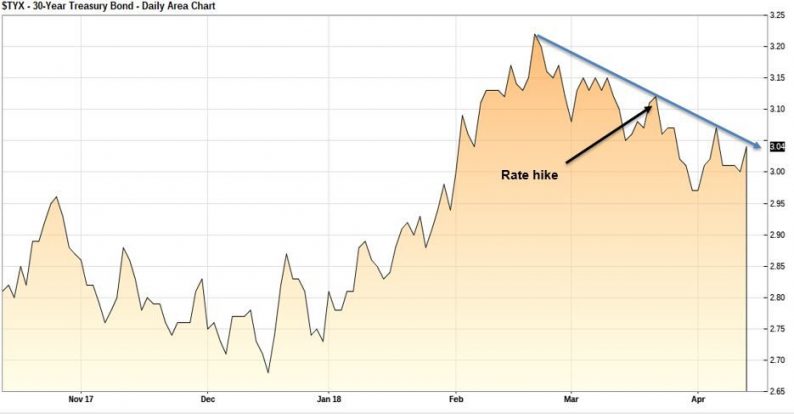
As I mentioned earlier, even though stocks gyrated like crazy, Treasury bonds were fairly tame. Take a look at a chart of the 30-year Treasury bond:

The blue line defines the current downtrend for yields. Interestingly, long-term Treasury yields are still lower than they were when the Federal Reserve hiked rates last month.
But forget all the chatter that’s caused such angst in the equity markets.
If you want to get a true pulse of the market, just look at the Treasury space. Sure, Treasury bonds will move when trading capital moves in and out of risk assets like stocks into the safety of bonds. But, recently – as you can see in the chart – Treasury yields were pretty steady during all of the recent volatility in stocks.
When long-term bonds fall while short-term bonds rise, that’s an indication that investors don’t really believe inflation is a big risk yet, or maybe that the economic outlook isn’t that rosy.


Leave A Comment