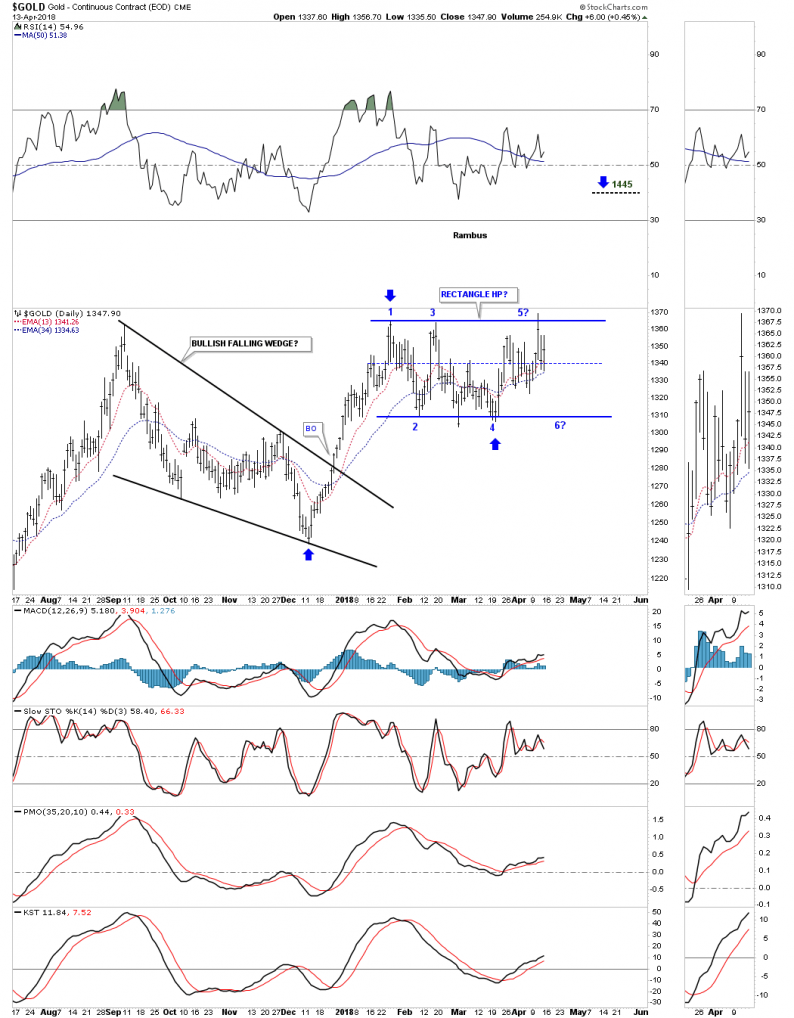
For the last three months gold had been chopping out a rectangle trading range which has completed four reversal points so far. Wednesday of this week it looked like gold may breakout above the top rail but the bears stopped the advance just when it looked like the bulls were finally going to win.
Many times before a rectangle is finished building out there can be one last move back down to the center of the rectangle where support is found. If the bulls are truly in charge they could take this opportunity to rally gold up and through the top rail to complete the rectangle as a halfway pattern. If the bulls can muster up enough energy to take out the top rail the rectangle would have a price objective up to the 1445 area as shown by the blue arrows. At this point there is no way to know if we’ll see another reversal all the way back down to the bottom of the rectangle which would complete the 5th reversal point. It’s still a consolidation pattern at this time.

Below is a weekly line chart which shows the possible five year H&S base building out. The three month rectangle we just looked at on the daily chart above is building out just below the neckline. We’ve discussed many times in the past that it can be a bullish situation when we see a small pattern form just below an important trendline, in this case the neckline. These smaller patterns can give the energy a stock needs to finally takeout that important trendline. Gold tested the neckline again this week pushing slightly above the neckline, but the bulls were unable to hold on.
We know that neckline is very hot by the many touches it has had in the last five years. If gold is finally ready to break out it will be interesting to see how it does it. Since there is such a well defined line in the sand we could see a big breakout gap as all the bears that have been defending that neckline are finally exhausted with none left to put up a fight. The line in the sand comes in at 1365.


Leave A Comment