
The U.S. government’s 2017 fiscal year officially ended on 30 September 2017. At that time, we knew that the total public debt outstanding of the U.S. government increased by $671.5 billion from the end of the previous fiscal year, rising from $19,573 billion (or $19.6 trillion) to $20,245 billion (or $20.2 trillion) during FY2017.
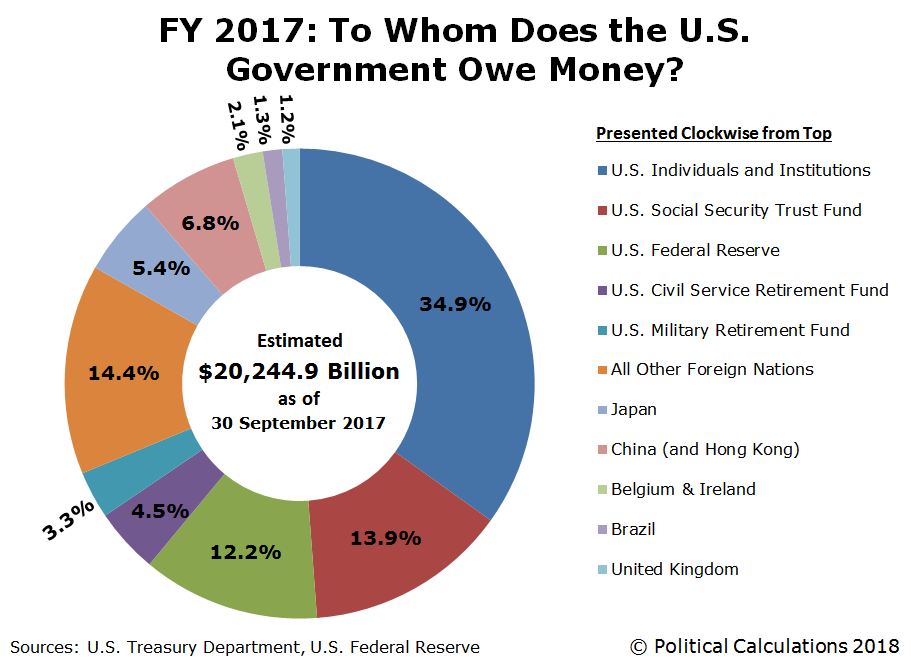
But what we didn’t know was exactly how much the U.S. government owed to many of its major creditors, particularly foreign interests, where we have had to wait for subsequent revisions to find out! A little over six months later, those revisions are now in the rear view mirror, where the following chart shows who the U.S. government’s major creditors were at the end of FY 2017:
According to the U.S. Treasury Department, the U.S. government spent some $665.7 billion more than it collected in taxes during its 2017 fiscal year. The difference between this figure and the $671.5 billion that the total national debt actually rose can be attributed to the government’s net borrowing to fund things like Federal Direct Student Loans, which collectively account for nearly $1.1 trillion of the government’s $20.2 trillion debt, or 5.4% of the total public debt outstanding.
Put differently, the U.S. national debt would be 5.4% less at roughly $19.1 trillion if not for the federal government’s takeover of the student loan industry from the private sector in March 2010. Since that time, approximately $1 of every $10 that the U.S. government has borrowed has been for the purpose of funding its student loan program.
Overall, 69% of the U.S. government’s total public debt outstanding is held by U.S. individuals and institutions, while 31% is held by foreign entities. China has resumed its position as the top foreign holder of U.S. government-issued debt, with directly accounting for 6.8% between institutions on the Chinese mainland and Hong Kong, taking over from Japan, whose share of U.S. government-issued debt holdings has dropped to 5.4%.


Leave A Comment