With three-quarters of calendar year 2017 now in the books, investors may wonder where the U.S. economy goes from here. Last week, the Bureau of Economic Analysis reported that third-quarter real gross domestic product (GDP) rose at an annual rate of +3.0%, following on the heels of a +3.1% reading in the second quarter. This was the best back-to-back quarterly performances in exactly three years. Is there any type of gauge that could help investors, or perhaps at least provide some guidance on what could be looming ahead? One such gauge is the U.S. Treasury (UST) yield curve.
When observing trends in the UST market, the focus tends to be on developments for the 10-Year maturity. However, not all Treasury maturities are the same in terms of how their respective yields respond to different factors. Against this backdrop, to get a more detailed sense of overall sentiment on the rate front, we recommend analyzing the yield curve.
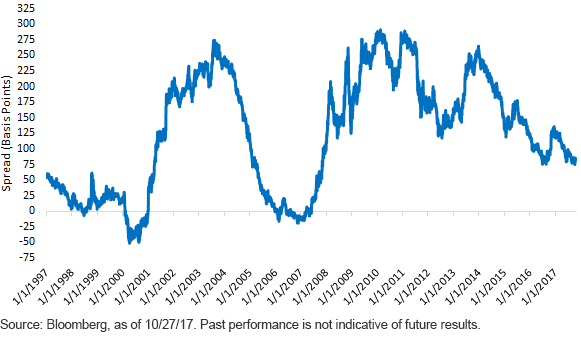
U.S. Treasury 2-Year vs. 10-Year

So where does the UST yield curve stand as we enter the final two months of 2017? The predominant year-to-date trend has been for the 2-Year/10-Year spread to flatten. To provide some perspective, since late December, this spread has narrowed by more than 50 basis points (bps) to +82 bps, as of this writing. How has this flattening occurred? This narrowing trend has been a clear illustration that yield levelsamong UST maturities do not necessarily move in the same direction. In this case, the UST 2-Year yield rose 40 bps, while the 10-Year rate fell almost 15 bps.
That leads to the question, why did short-term rates rise while longer-dated yields moved lower? The first part of the equation lies with the Federal Reserve (Fed). Thus far this year, the U.S. central bank has raised the Fed Funds target twice, and despite the pause at the September Federal Open Market Committee meeting, additional increases are still expected for later this year and into 2018. The front end of the yield curve, or shorter-dated maturities such as a UST 2-Year note, tend to be the area that is most directly affected by changes in the Fed Funds Rate.


Leave A Comment