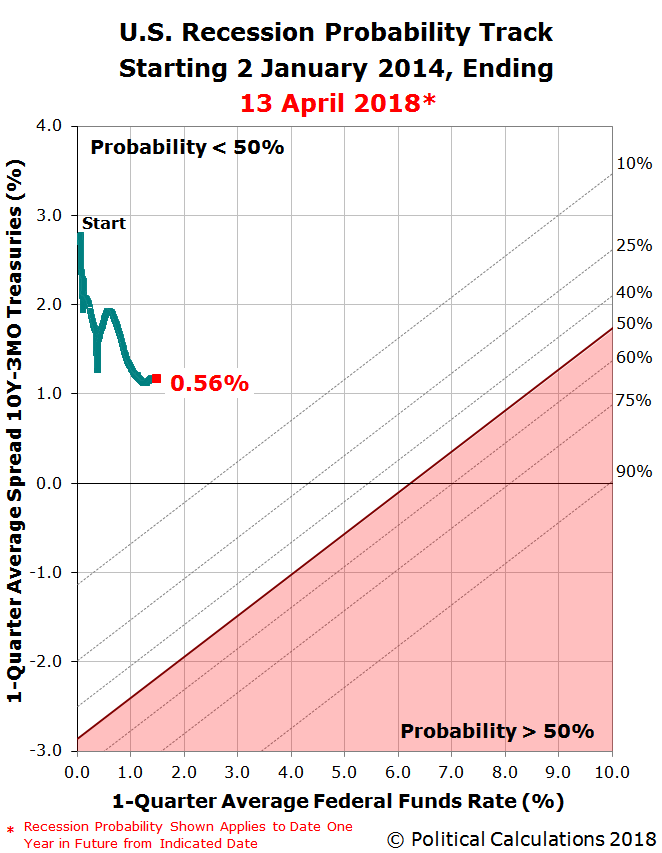
The risk of a national recession beginning in the United States anytime in the next twelve months, or specifically between 13 April 2018 and 13 April 2019, has ticked up toward 0.6% from our previous reading of just above 0.5% a month ago.

As expected, that uptick is primarily the result of the Federal Reserve’s most recent quarter-point rate hike, which was announced on 21 March 2018, where the target range for the Federal Funds Rate now stands between 1.50% and 1.75%. At the same time, the U.S. Treasury yield curve has largely remained steady since our last update, where the spread, or difference, between the yields of the constant maturity 10-Year Treasury and the 3-Month Treasury is within 1/100th of a percentage point of what it was a month ago.
The story is a bit different as you move up the Treasury yield curve, where the spread between the 10-Year and the 2-Year Treasuries has narrowed to reach its smallest difference in nearly a decade, which is raising red flags in some quarters on Wall Street. By contrast, our recession probability analysis is based on Jonathan Wright’s 2006 paper describing a recession forecasting method using the level of the effective Federal Funds Rate and the spread between the yields of the 10-Year and 3-Month Constant Maturity U.S. Treasuries, which should be less susceptible to false alarms.
Looking forward, if you use the latest data for the treasury yields and the Federal Funds Rate in our recession odds reckoning tool, you’ll find that your results will differ from the data we’ve presented in the chart above. That is because the chart follows Wright’s methodology in using the one-quarter average for the yields and rates data used in its calculations, where the tool’s results based on the most recently available data can be taken as an indication of the direction that the recession probability track is most likely heading when compared with the information provided by our recession probability track chart.


Leave A Comment