
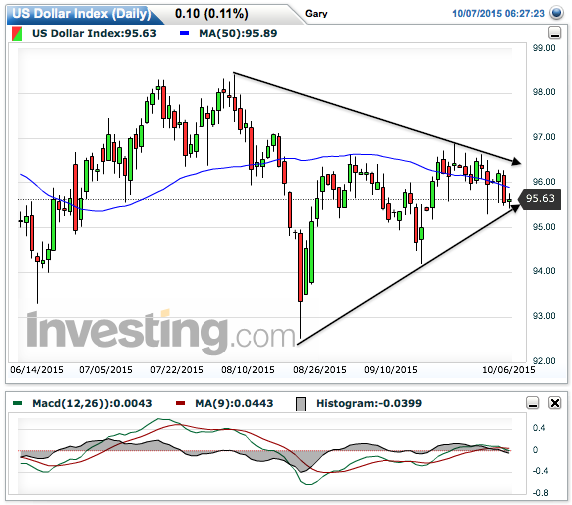
US dollar daily is in the nose of a somewhat Symmetrical Triangle just below the MA 50. MACD is turned down.
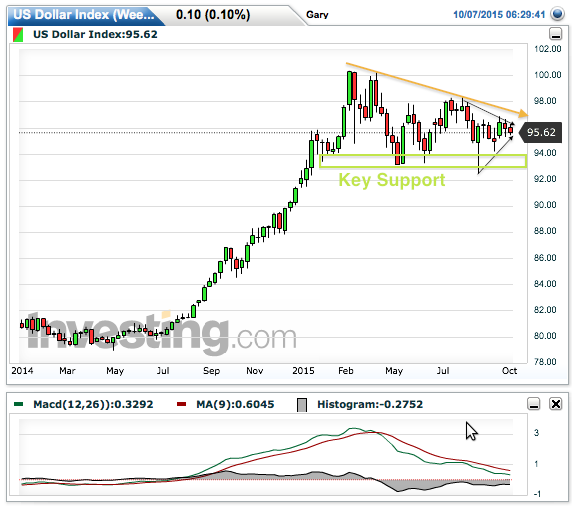
US dollar weekly shows the little triangle and also key support (to the consolidation of last year’s impulsive rise), which is and has been 93-94. The orange arrow is the key to breaking the consolidation on the upside. If that is what the entirety of 2015 is, a consolidation, it looks like Uncle Buck would go much higher when it breaks. The best that can be said about MACD is that it is no longer over bought (that’s what consolidations do).
But if Unc breaks down, there is long-term support built in. It has already lightly tested 92 and as long as that holds up, USD is in bullish consolidation, preparing for higher levels. If however, 92 is breached, 88 is the next stop. It’s a far cry from the USD-centric inflation hysterias of 2007 and 2010, but it could come in tandem with a bounce in the ‘inflation trade’.
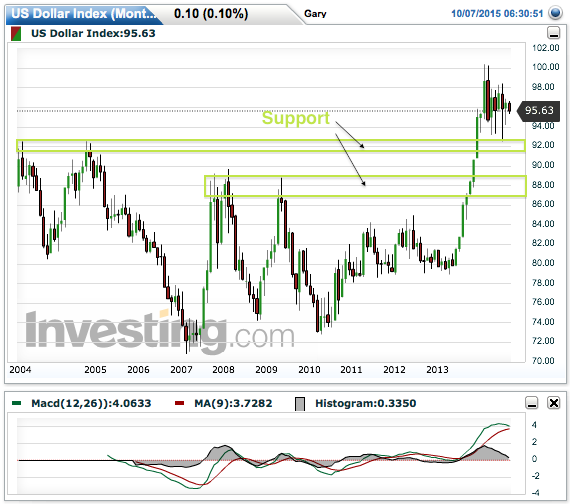
With commodities bouncing, we are at least open to the idea that Unc could fail and test lower support levels. But looking at the chart directly above, it continues to look like a currency working off the hysterical over bought situation in 2014 as the MACD lines draw closer and so, is bullish on the big picture.


Leave A Comment