
I stated many times that it is very hard, or even impossible, to predict the stock market. However, sometimes Mr. Market delivers quite clear indications that something different is in the making.
Let me take the US stock market. Here is the chart showing the so-called NAAIM Exposure index:
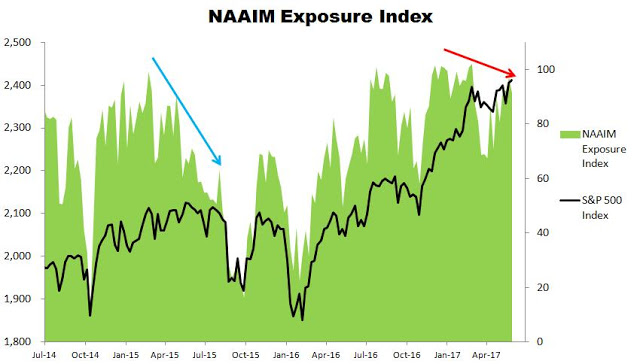
source: NAAIM
According to the NAAIM: “The NAAIM Exposure Index represents the average exposure to US Equity markets reported by our members”
It looks like most recently American investment managers are a little bit less bullish on US stocks than before (despite the index printing new historic highs).
Additionally, the red arrow depicts the divergence between the S&P index and the NAAIM. Interestingly, such divergence is quite a rare event. The last time it occurred (middle 2015 – the blue arrow), the US stock market dived 20% shortly after.
Well, I know that the US stock market is unstoppable (forgive me for being a little bit sarcastic) but now it is waving a rare red flag…


Leave A Comment