Although currency bears pushed the greenback lower against its Canadian counterpart earlier today, the medium-term support line based on September and October lows continues to keep declines in check. What does it mean for USD/CAD?
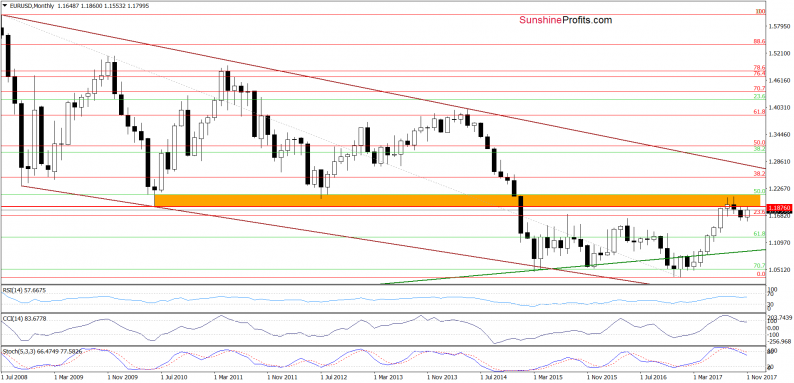
EUR/USD
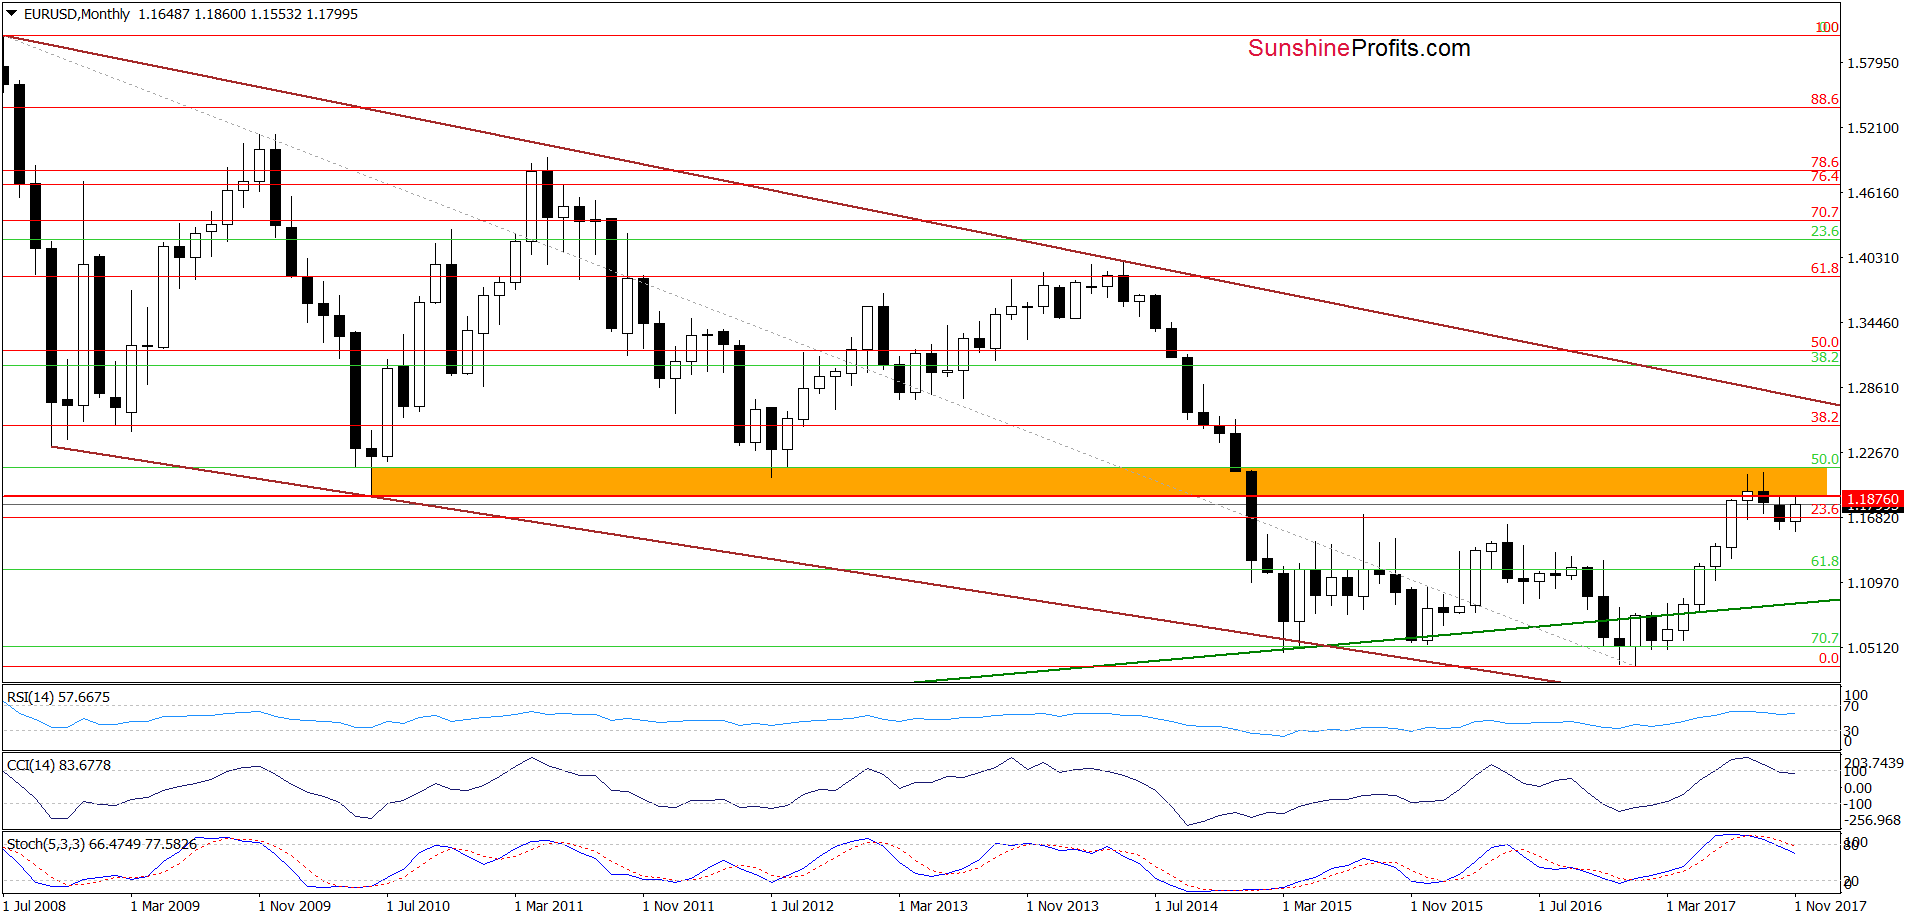
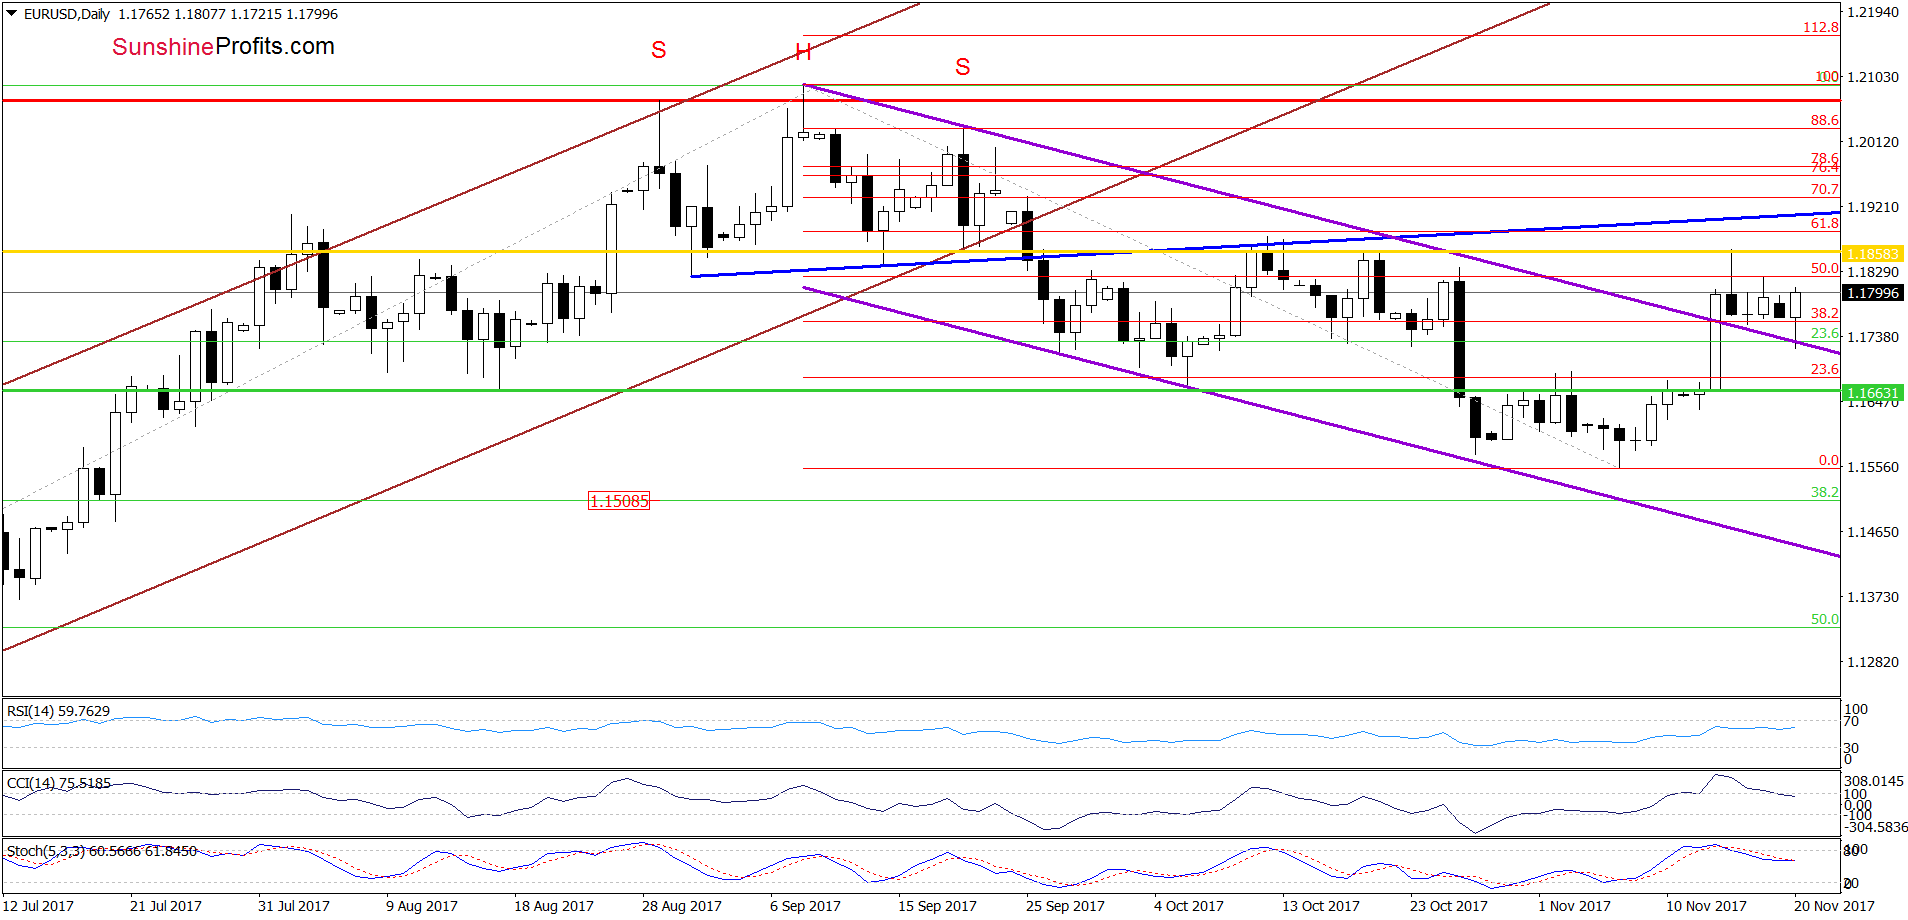
Earlier today, EUR/USD slipped slightly below the previously-broken upper border of the purple declining trend channel, but then invalidated quickly this tiny drop, which triggered further improvement. Despite today’s increase, the exchange rate remains under the 50% Fibonacci retracement and the lower border of the orange resistance zone (marked on the monthly chart), which together with the sell signals generated by the monthly and daily indicators suggest that another move to the downside may be just around the corner.
Therefore, in our opinion, if the exchange rate reverses and declines from current levels, the initial downside target will be the upper border of the purple trend channel once again. Further deterioration however, will be even more likely if EUR/USD invalidates the breakout above the upper line of this formation in the following day(s). If we see such price action, we think that currency bears will not only test the green horizontal line, but also push the pair to the 38.2% Fibonacci retracement.
Very short-term outlook: mixed with bearish bias
Short-term outlook: bearish
MT outlook: mixed
LT outlook: mixed
USD/CAD

The situation in the medium term hasn’t changed much as USD/CAD still remains in the blue consolidation. Therefore, we think that as long as there is no breakout above the upper border of the formation or a breakdown under the lower line, the situation will remain a bit unclear and short-lived moves in both directions should not surprise us.
Will the very short-term chart give us more clues about future moves? Let’s check


Leave A Comment