
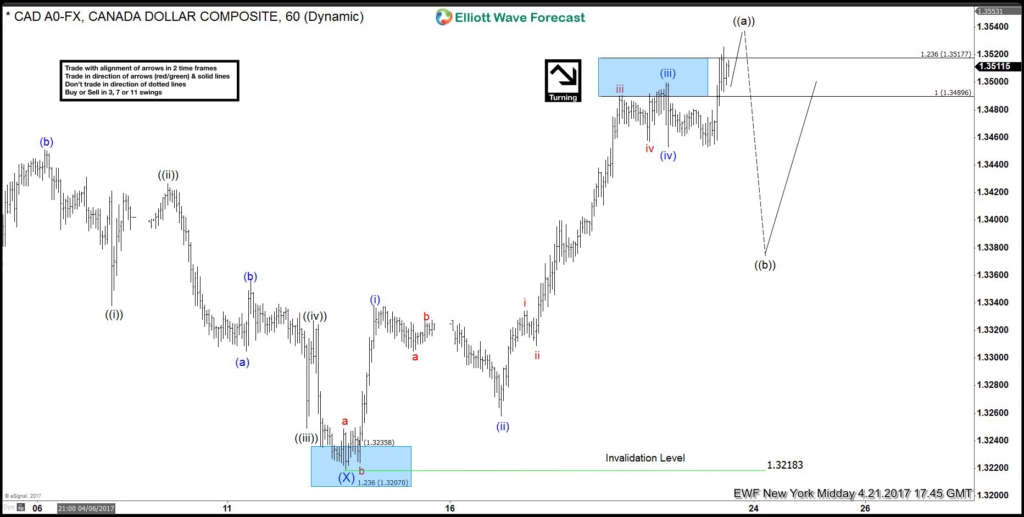
Short term Elliott wave view in USDCAD suggests that the cycle from 4/13 low (1.3218) is unfolding as an impulsive Elliott wave structure. This 5 wave move could be wave ((a)) of an Elliott wave zigzag structure or wave ((c)) of a FLAT correction. In either case, after 5 wave move ends, the pair should pull back in 3 waves at least as the Elliott Wave Theory suggests.
Minutte wave (i) ended at 1.3337, Minutte wave (ii) ended at 1.3261, Minutte wave (iii) ended at 1.3498, Minutte wave (iv) pullback ended at 1.3455 low and above from there Minutte wave (v) of ((a)) already reached the minimum extension area between 1.3509-1.3527 which is the inverse 1.236-1.618% Fibonacci extension area of proposed wave (iv) dip. This means the cycle is now mature and can end at any moment resulting in a 3 wave pullback at a minimum.
The pull back is shown to be wave ((b)) and should correct the cycle from 4/13 low in 3, 7 or 11 swings. If the decline turns out to be stronger than expected and breaks the pivot at 1.3218 low, that would suggest the 5 waves move up from 1.3218 low was a B wave FLAT from 3/21 (1.3261) low and the pair could then see 1.3252 – 1.3187 area before bouncing again. Although Minutte wave (v) of ((a)) has reached the minimum extension area, another high towards (v) = (i) target @ 1.3571 can’t be ruled out to end wave ((a)) cycle from 4/13 low. In either case, cycle from 4/13 (1.3218) low is mature and should result in a pull back soon.
USDCAD 1 Hour Elliott Wave Chart


Leave A Comment