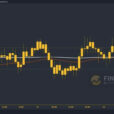
VIX declined to a late Master Cycle low on April 17, then proceeded to rally above Intermediate-term support at 16.81. VIX is now on a buy signal.
(ZeroHedge) When Morgan Stanley’s chief equity strategist Michael Wilson released his 2018 equity outlook earlier this year, one particular observation struck us: a curious correlation between volatility and the shape of the yield curve we had not seen anywhere previously.
In his discussion in late November 2017, Wilson explains why he expected bigger volatility in the coming year, and why he thought “things will change in 2018” he shows the following chart which illustrates an interesting relationship between equity volatility and the economic cycle.
SPX repelled at Intermediate-term resistance
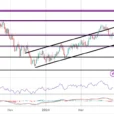
SPX extended the rally through Wednesday, rising above the 2-year trendline in a throw-over to Intermediate-term resistance at 2713.96. It appears to have made an island reversal on the daily charts at Thursday’s open. The two-year trendline was broken on Friday morning, giving it a sell signal. A break beneath Long-term support at 2602.31 confirms the new outlook.
(Reuters) – U.S. stocks fell on Friday, as Apple led a decline in technology stocks on concerns about weak iPhone demand and investors worried about the impact of a rise in U.S. bond yields.
Apple fell 3.8 percent and was the biggest drag on the major indexes after Morgan Stanley estimated weak demand for its latest iPhones, adding to fears raised by Taiwan Semiconductor of softer smartphone sales.
Microsoft, Intel and Cisco were the other big decliners, leading to a 1.6 percent drop on the S&P technology index, its third straight day of decline.
NDX “throws over” the trendline, reverses
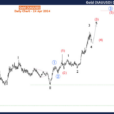
The NDX also threw over its two-year trendline before making a key reversal on Thursday. It has declined through the trendline and Intermediate-term support at 6720.97, putting it on a sell signal. Declining through Long-term support at 6455.27 confirms the sell signal.
(DailyReckoning) Liquidity is the ultimate paradox in finance. It’s always there when you don’t need it and never there when you need it most. The reason is crowd behavior, or what mathematicians call hypersynchronicity (a fancy word for everyone doing the same thing at the same time).
When markets are calm, no one wants liquidity because investors are happy to hold stocks, bonds, currencies, commodities and other assets in their portfolios. As a result, there’s plenty of liquidity on offer from bank lenders and very few takers.
The opposite is true.
In a financial crisis, everyone wants his money back at once. Stocks are crashing, bonds are crashing, margin calls are streaming in and everyone is trying to sell everything at once to avoid losses, meet margin calls and preserve wealth.
In those circumstances, there’s not enough liquidity to go around. Banks, and ultimately regulators, decide who lives and who dies (financially speaking) by offering liquidity or cutting it off.
High Yield Bond Index repelled at Intermediate-term resistance
The High Yield Bond Index continued to rally above its trendline, reaching Intermediate-term resistance at 192.18 before making a reversal, closing above the trendline. The trendline may not hold. A broken Diagonal trendline infers a complete retracement to its origin. This may happen in a very short period of time.
(ZeroHedge) After rising for 10 of the previous 11 days, ever-hopeful that we can get back to ‘abnormal’, it appears a realization of just how levered US corporates are, as well as testing and losing a key technical level, prompted the biggest fund outflow from HY bond ETF since the 2016 election…with HY Yields at their lowest decile on record.
UST resumes its decline
The 10-year Treasury Note Index resumed its decline beneath Short-term support at 120.41 this week. Last week I mentioned, “…a breakdown may have dramatic consequences.” The Head & Shoulders target may be next on the agenda.
(CNBC) The yield on the 10-year Treasury note hit 2.96 percent Friday, hitting its highest level since Jan. 10, 2014.
The two-year yield hit 2.461 percent, meanwhile, its highest level since Sept. 8, 2008, when the two-year yielded as high as 2.542 percent. Friday’s moves cap a week of rising rates accredited to geopolitical and trade tensions, rising commodity prices and an uptick in German bund yields.
As of the latest reading, the yield on the benchmark 10-year Treasury note was higher at around 2.96 percent at 3:52 p.m. ET, up roughly 10 basis points for the week. The yield on the 30-year Treasury bond was up at 3.146 percent, approximately 8 basis points higher since Monday. Bond yields move inversely to prices.


Leave A Comment