
EUR/USD (1.11): The single currency has started to ease back following the post-ECB rally. Failure to test the upper resistance near 1.123 signals a potential pullback with the upside bias in the near term likely to stay intact. Support to the current declines come in at 1.095 – 1.10 region which is likely to be critical in the short term. A break below this support could see EUR/USD slip down to 1.081 – 1.075 support.
The new median line sloping down shows the significance of the 1.095 – 1.10 support, which could potentially mean a decline lower if the support fails, this downside view is also further validated by the lower high posted against the previous highs above 1.13. In the short term, EUR/USD is likely to remain under pressure as the FOMC meeting due on Wednesday edges closer.

EUR/USD – Likely to test towards 1.10 – 1.09
USD/JPY (113.4): The consolidation in the price action since February 10th has seen USD/JPY caught in a range. The minor inverse head and shoulders pattern being formed will be critical as a break above the 114 neckline support could confirm a new leg in USD/JPY to the upside. The inverse head and shoulders pattern could see a minimum move to the upside towards 115 with the potential for a rally to continue pushing the Greenback towards the 117 resistance level, which is validated by the bullish divergence to the Stochastics and the support being established near 112.5 – 112.0 levels.
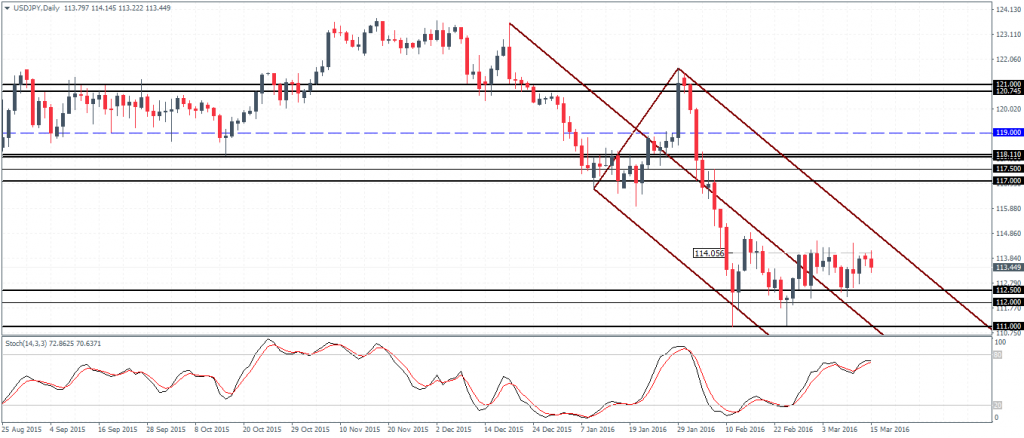
USD/JPY – Minor Inverse Head and Shoulders Pattern
GBP/USD (1.42): The Cable has managed to breakout from the resistance level near 1.42 – 1.41 region. A decline lower could see this newly breached resistance being tested for support. Establishing support here could prepare GBP/USD for a new leg higher towards the 1.463 resistance level. Alternately if the support near 1.42 – 1.41 fails, GBP/USD could see a decline back below the falling trend line with bearish momentum, targeting the 1.40 handle. Below 1.40 there is scope for the currency to post new lows if it goes beyond the previous low near 1.3865. To the upside, the gains in GBP/USD will be limited to 1.4635 through 1.481 at the minimum. Above 1.481, GBP/USD could be looking to trade towards the 1.50 psychological level.


Leave A Comment