
The economic calendar is normal, with an emphasis on inflation data and the Fed. The increased intra-day volatility, often driven by overnight comments in China news or a Presidential tweet, has everyone’s attention. Even Fed punditry will take a back seat. With an increased sense of urgency, many will be wondering: has the Trump trade reached the tipping point?
Last Week Recap
In my last edition of WTWA I asked whether stock prices had veered from the fundamentals. That was a good guess, since the topic was popular in discussions all week.
The Story in One Chart
I always start my personal review of the week by looking at a great chart. I always start my personal review of the week by looking at a great chart. I especially like the version updated each week by Jill Mislinski. She includes a lot of valuable information in a single visual. The full post has even more charts and analysis, so check it out.
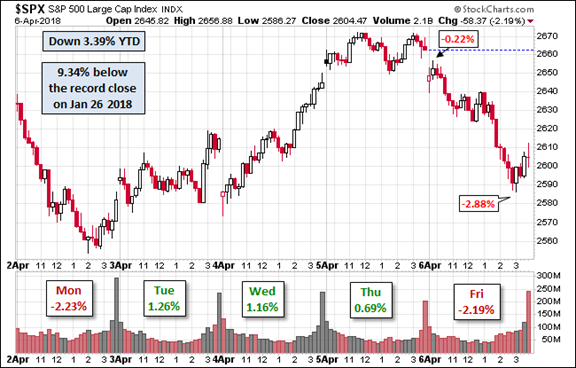
The loss this week was only 1.4%, but the dramatic daily moves made it seem like more. The trading range was 4.8% including 3% in a single day. I summarize actual and implied volatility each week in the Indicator Snapshot.
The News
Each week I break down events into good and bad. For our purposes, “good” has two components. The news must be market friendly and better than expectations. I avoid using my personal preferences in evaluating news – and you should, too.
Feel free to add items that I have missed. Please keep in mind that we are looking for current news, especially from the last week or so. WTWA is not about long-term concerns like debt. These are important, of course, but not our weekly subject unless there has been some major change.
The Good
The Bad
The Ugly
An unwanted Korean war? Foreign Affairs explains how it could happen. Secret direct talks suggest that there is some progress in mitigating this threat. The planned summit between President Donald Trump and North Korea leader Kim Jong Un should be watched closely. Stratfor (via GEI) has a deeper look about why the current situation is concerning.


Leave A Comment