After the news-heavy calendar last week, there are few market-moving economic reports in the week ahead. It is also the quiet period for the Fed. How will the punditry fill those empty minutes?
Last week’s trading revived a question that many find puzzling. I expect pundits to be asking:
How can bonds and stocks both be so strong?
Last Week
Last week the economic news was mixed, but the market showed strength anyway.
Theme Recap
In my last WTWA I took note of the big economic calendar and short week. My conclusion was that we might finally see some volatility. Wrong! The news was close enough to expectations that the reactions were modest. Since there was little volatility, it never became the theme for the week.
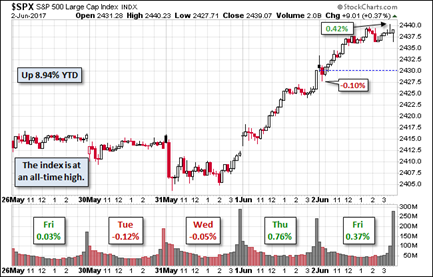
The Story in One Chart
I always start my personal review of the week by looking at this great chart from Doug Short via Jill Mislinski. The gain for the week, achieved entirely on Thursday and Friday, was almost 1% and another new all-time high.

Doug has a special knack for pulling together all the relevant information. His charts save more than a thousand words! Read the entire post for several more charts providing long-term perspective, including the size and frequency of drawdowns.
Personal Note
I am considering some changes in WTWA. Instead of launching “new Coke” without proper testing, I would like reader suggestions. I have outlined the ideas here, and I welcome comments and suggestions.
The News
Each week I break down events into good and bad. Often there is an “ugly” and on rare occasion something very positive. My working definition of “good” has two components. The news must be market friendly and better than expectations. I avoid using my personal preferences in evaluating news – and you should, too.
The economic news last week was mixed, but the market reaction was positive.
The Good

To be balanced, we must also note the increasing leverage of corporations. BlackRock notes that this reflects the low cost of loans versus equity. More of the lending locked in for a long period.

Any assessment of debt and leverage must include government. It is a concern, and on my writing agenda.
Consumer confidence declined slightly, but remained at a high level – 117.9. Here is the analysis from the Conference Board:
Consumer confidence decreased slightly in May, following a moderate decline in April,” said Lynn Franco, Director of Economic Indicators at The Conference Board. “However, consumers’ assessment of present-day conditions held steady, suggesting little change in overall economic conditions. Looking ahead, consumers were somewhat less upbeat than in April, but overall remain optimistic that the economy will continue expanding into the summer months.
The Bad
He writes as follows:
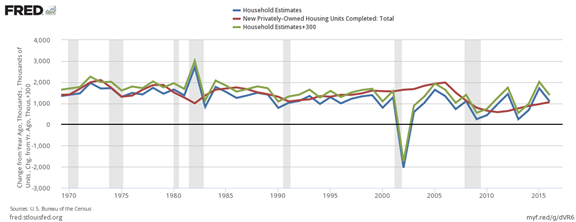
Based on the data in the above graph, since the beginning of the Great Recession there were almost a half million more new homes constructed than households formed. Up until the 21st century, there was good correlation between household formation and homes constructed.
However, historically 300,000 new homes are needed each year to replace those lost to fires, rot, other causes, or simply torn down to make way for new construction. Based on just replacements needs, 3 million new houses were needed since the beginning of the Great Recession instead of the half million above household formation actually constructed. The green line in the above graph is the combined need for new housing (year-over-year gain of households plus the replacement housing).
The bottom line is that the NEED for new construction is outpacing the supply. It seems the price for new and existing housing is above the price many buyers are willing (or can afford) to pay. It seems that there is a shortfall also of buildable land near many metros where people want to live.


Leave A Comment