There’s a fork in the volatility road.
Baseball’s Yogi Berra really ripped up a leaf from Robert Frost’s poetry anthology when he said: “When you come to a fork in the road, take it.” Traders watching the market for S&P 500 stocks are now facing a Yogi-like fork in the road and wondering which tine to follow. Specifically, it’s a divergence in the pricing of S&P 500 Index options that’s got traders and institutional investors puzzled.
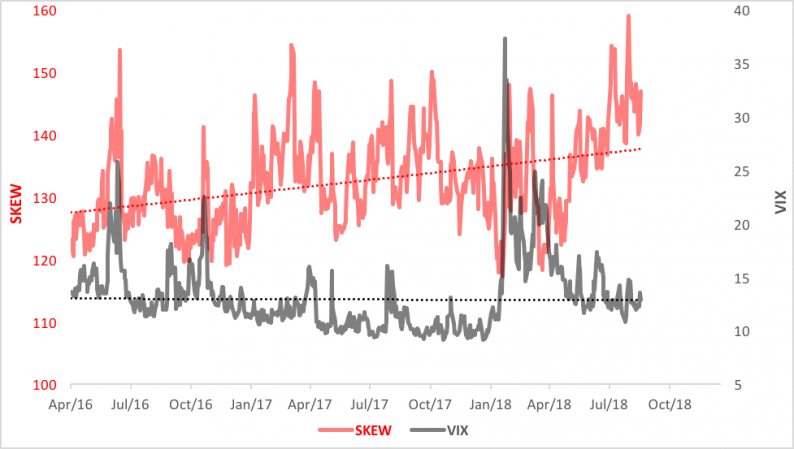
Everybody seems to know about VIX, the so-called “fear index” (in actuality, the Cboe Volatility Index). VIX is derived from the implied volatility embedded in near-term S&P options and measures market expectations of future volatility. The reason VIX is dubbed a fear index is that it historically spikes higher as traders’ trepidations about declines in the S&P 500 increase. VIX is depicted as the black line in the chart below. You can see the index shot upward in February this year as stocks swooned, then trended downward in the wake of the market break.

VIX, in fact, is heading back towards the level of complacency that preceded the February collapse.
Contrast that with the trajectory of the Cboe SKEW Index (SKEW). Similar to VIX, SKEW is calculated from S&P 500 Index options, but SKEW measures the degree of “tail risk” priced into the derivatives.
The volatility assumption in VIX is rooted in a normal distribution—a “bell-shaped curve”—of returns where the “tails” representing standard deviations above (to the right of) and below (to the left of) the mean are similar. History, however, shows that the S&P 500 distribution is anything but normal. The frequency of outlier returns—two or three standard deviations from the mean—is, in fact, greater than that of a normal distribution. To boot the return distribution is skewed negatively. In other words, S&P 500 returns carry left tail risk. “Fat” tail risk. SKEW is trending higher now—and tail risk increasing—as VIX has slumped.


Leave A Comment