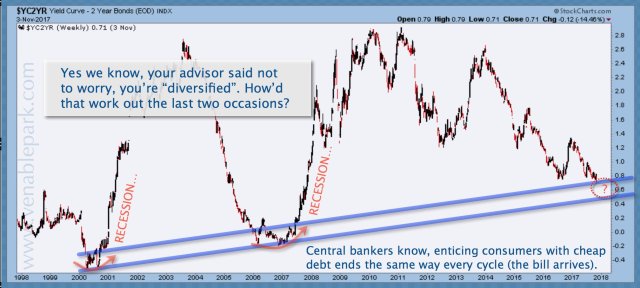
North American yield curves are narrowing further today, now with less than .5% between the 10 and 2 year Treasury yield in Canada, and less than .70% in the US. Both are now at the narrowest spread since the last market cycle peak in 2007.
Here is my partner Cory Venable’s update chart showing the US 2 and 10-year spread since 1998. When the spread hits zero, a recession has historically been underway. And, no, your conventional portfolio of equity and corporate debt securities is no more ‘diversified’ ie., ‘protected’ against the downside today than it was in the last bear cycles.

Meanwhile, China’s yield spread is already inverted, and its central bank governor Zhou Xiaochuan released another warning on the weekend about the perilous state of extreme debt and financial leverage in China that is posing “hidden, complex, sudden, contagious and hazardous,” risks to the global financial system. Here is a direct video link.
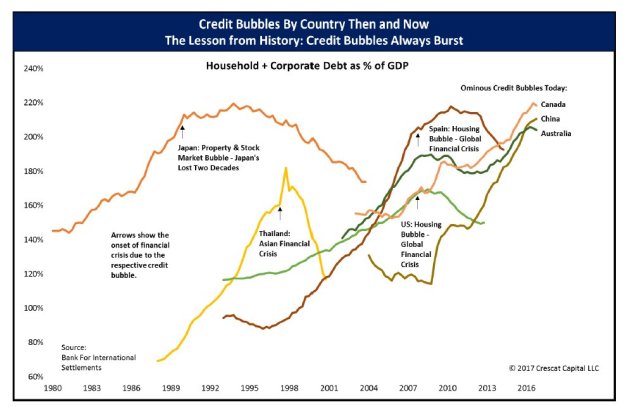
As shown in this retrospective chart of household and corporate debt levels as a percent of GDP in the 8 credit booms and then bust since 1980, Canada and Australia have gone lock step with China on massive debt expansion since 2008. They therefore also now have the most to give back in the mean reversion of debt, asset prices and GDP from here. When it comes to debt-fueled cycles, the end is never different.


Leave A Comment