On July 3, we discussed the divergence between the Markit and ISM diffusion indexes for manufacturing.
Today, let’s look at ISM Nonmanufacturing vs Markit Services.

Real GDP

If the economy was indeed growing for 95 consecutive months (Nearly 8 Years), the above chart would not look like it does.
For the first quarter, ISM estimated 4.3% GDP growth.
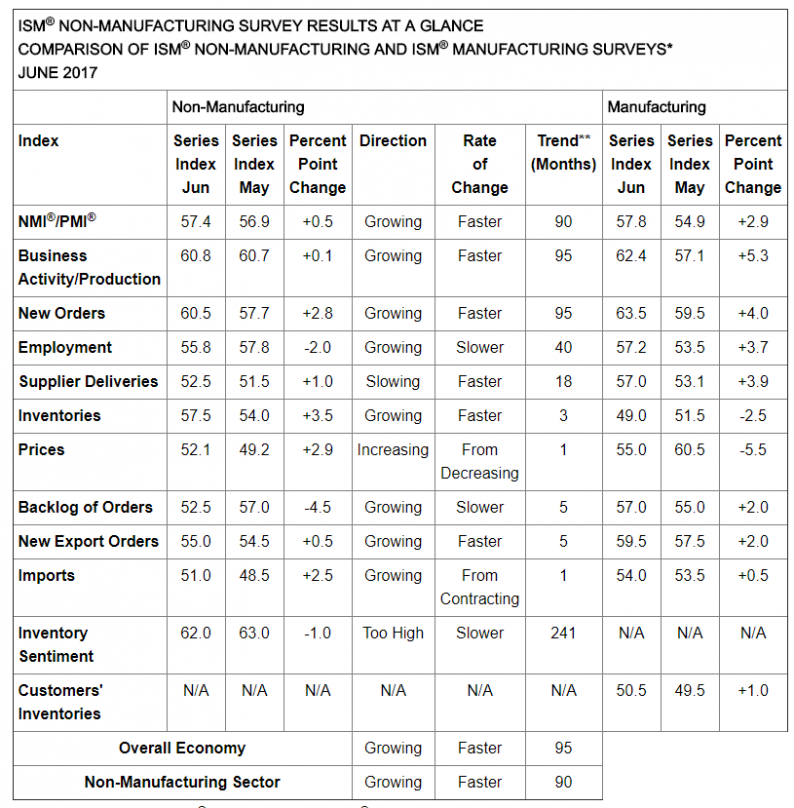
Today the ISM says “The past relationship between the NMI® and the overall economy indicates that the NMI® for June (57.4 percent) corresponds to a 3.3 percent increase in real gross domestic product (GDP) on an annualized basis.”
Markit Services PMI
IHS Markit U.S. Services PMI™ – final data (with composite PMI™)
Key Findings
- Strongest expansion in business activity since January
- New order growth also at five-month high
- Input prices rise at fastest pace in two years
The final seasonally adjusted IHS Markit U.S. Composite PMI™ Output Index rose to 53.9 in June, up from 53.6 in the previous month.
Although the composite figure picked up in June, the rate of growth remained historically muted. Nonetheless, the average pace of expansion indicated over the first half of the year was faster than that seen during the same period last year.
The rate of growth in the services sector was stronger than the manufacturing sector for the first time since June 2016, according to latest survey data.
Chris Williamson Markit Chief Economist Comments


Leave A Comment