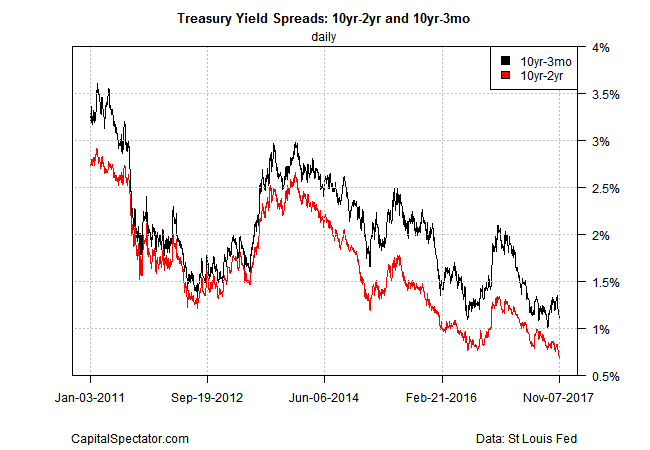
A widely followed measure of the Treasury yield curve dipped on Tuesday (Nov. 7) to its flattest level in a decade, based on daily data published by Treasury.gov. The gap between the 10-year and 2-year rates fell to 69 basis points yesterday – the lowest since Nov. 2007.
The flatter yield curve follows in the wake of upbeat economic data for the US economy in recent weeks, including 3% GDP growth in the second and third quarters – the strongest back-to-back quarterly gains in three years. Meanwhile, the market is expecting that the Federal Reserve will continue to raise interest rates at next month’s policy meeting — a forecast that suggests the curve will become even flatter, assuming that long rates fall or hold steady. Fed funds futures are currently pricing in a 92% probability that the central bank will announce a hike in its target rate on Dec. 13, based on CME data this morning.

The Treasury curve has been relatively flat for most of the year to date relative to 2016’s close. As of yesterday, short maturities through five years are above last year’s ending yields while rates for seven years through 30 years are below 2016’s year-end levels.

Deciding how to interpret the flatter yield curve is a matter of debate among analysts. Rick Rieder at BlackRock, for example, told Bloomberg last week:
Long-term Treasuries are “crazy priced wrong to the expensive side,” along with debt in Europe and Japan, in part because investors in those regions flock to the U.S. any time debt prices fall. That appetite keeps 10-year Treasury yields in a tight range even as the Federal Reserve sees economic growth warranting additional interest-rate hikes.
Meanwhile, Janus Henderson Group’s Bill Gross offers a different interpretation, advising that the Fed is running out of road to raise rates further, due to high levels of debt in the system. Another slide of 20 to 30 basis points for the 10-year/2-year spread would signal an upcoming recession, he reasons.


Leave A Comment