
AT40 = 65.0% of stocks are trading above their respective 40-day moving averages (DMAs)
AT200 = 60.5% of stocks are trading above their respective 200DMAs
VIX = 11.3 (volatility index)
Short-term Trading Call: cautiously bullish
Commentary
During the big June 9th swoon in tech stocks, I was surprised to observe how well the stock market (in aggregate) performed. From Above the 40 at that time:
“While the carnage in big cap tech stocks was painfully clear – the PowerShares QQQ ETF (QQQ) declined 2.5% and the Nasdaq Composite declined 1.8% – most of the remaining stock universe was blissfully unaware of the pain.
My favorite technical indicator, AT40 (T2108), the percentage of stocks trading above their respective 40-day moving averages (DMAs), says it all. AT40 increased a solid 6.5 percentage points from 52.1% to 58.6%.”
Amazingly, a similar, albeit a little less dramatic, divergence happened to start the second half of the year. On July 3rd, a holiday-shortened trading day, the Nasdaq dropped 0.5% and the PowerShares QQQ ETF (QQQ) lost a convincing 1.1% which confirmed its 50DMA breakdown. At the same time, AT40 soared from 57.2% to 65.0%. My favorite technical indicator is now within sight of its first overbought reading (above 70%) in 106 trading days.
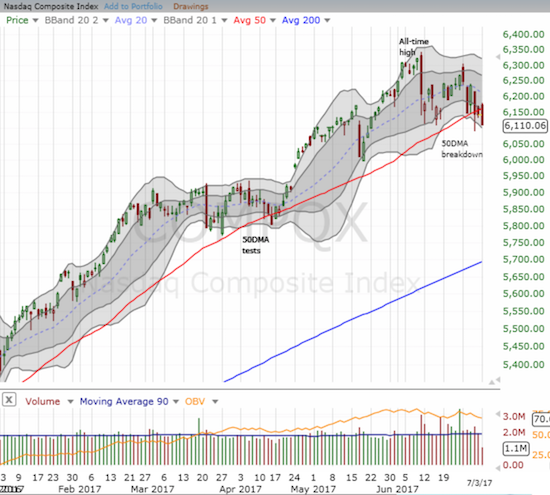
For the 3rd straight day, the Nasdaq closed below its 50DMA after trading above this trendline at some point in the trading day. So the breakdown has not yet been confirmed.
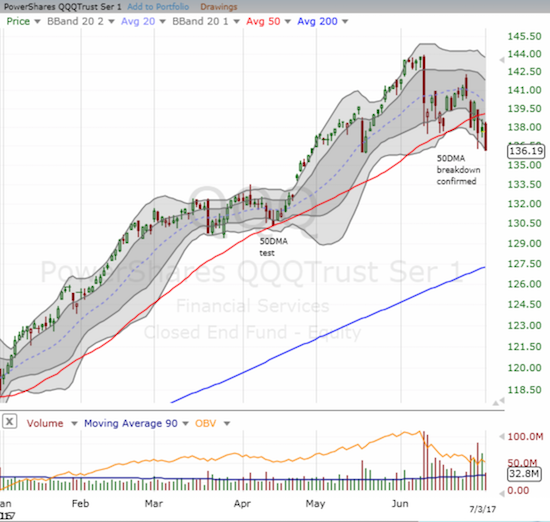
The PowerShares QQQ ETF (QQQ) confirmed its 50DMA breakdown with a close that exactly matched May’s closing low. Trading volume was average even though the trading day was shortened by the 4th of July holiday.
The S&P 500 (SPY) barely provided any clues to the divergence as it eked out a 0.2% gain after fading from its highs. I sold my SPY call options into the initial rally as I was nervous from seeing big cap tech wobble. I am still holding my QQQ call options with Apple (AAPL) put options as a pairs trade.


Leave A Comment