
AT40 = 48.7% of stocks are trading above their respective 40-day moving averages (DMAs)
AT200 = 51.9% of stocks are trading above their respective 200DMAs
VIX = 16.4
Short-term Trading Call: bullish
Commentary
It’s like deja vu again. The smoke just barely cleared from defusing Trump’s tripwire over trade wars, and now the market is wrestling with rumors that President Trump is considering tariffs on $60B in Chinese exports to the U.S. The headlines helped disturb a strong start to the trading day (I suppose Trump’s abrupt firing of Secretary of State Rex Tilerson added more negative weight to the day as well). The day ended for tech with bearish engulfing patterns eerily reminiscent of the topping pattern that preceded the last test of support at 50-day moving averages (DMAs). The Nasdaq and the PowerShares QQQ ETF (QQQ) tumbled 1.0% and 1.4% respectively.
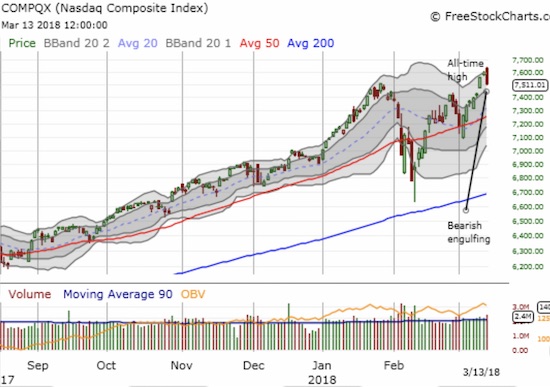
The Nasdaq fell from an all-time high with a 1.0% loss and a toppy bearish engulfing pattern. The close lined up exactly with the former all-time high and represents a reversal of the recent breakout.
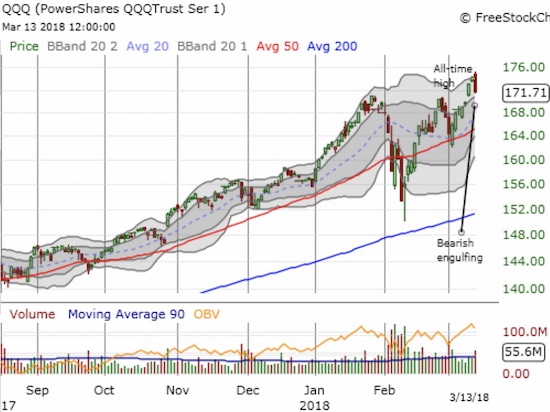
The PowerShares QQQ ETF (QQQ) lost 1.4%. Like the Nasdaq, QQQ printed a toppy bearish engulfing pattern and nearly reversed the recent breakout.
While the threat with tech stocks is a false breakout, the iShares Russell 2000 ETF (IWM) printed a bearish engulfing right at a test of all-time highs. Now IWM looks like a double-top.

The iShares Russell 2000 ETF (IWM) printed a double-top with a bearish engulfing pullback.
The S&P 500 (SPY) avoided the ominous bearish engulfing pattern. Still, its 0.6% loss brought momentum from last Friday’s breakout to a screeching halt. Suddenly, another test of 50DMA looks more likely to happen before a new all-time. I thought and hoped that tech’s new all-time highs blazed a path higher for the S&P 500.

The S&P 500 (SPY) lost 0.6% but stayed within its upper-Bollinger Band (BB) channel.


Leave A Comment