
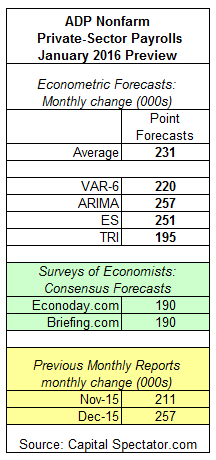
Private nonfarm payrolls in the US are projected to increase by 231,000 (seasonally adjusted) in January over the previous month in tomorrow’s update of the ADP Employment Report, based on The Capital Spectator’s average point forecast for several econometric estimates. The average projection reflects a moderately lesser rise vs. December’s increase.
The Capital Spectator’s average ADP forecast for January is well above two estimates based on recent surveys of economists.
Here’s a review of the numbers, followed by brief summaries of the methodologies behind the forecasts that are used to calculate The Capital Spectator’s average prediction:
ARIMA: An autoregressive integrated moving average model that analyzes the historical record of ADP’s estimate of private payrolls in R via the “forecast”package.
ES: An exponential smoothing model that analyzes the historical record of ADP’s estimate of private payrolls in R via the “forecast” package.
VAR-6: A vector autoregression model that analyzes six economic time series in context with ADP’s estimate of private payrolls. The six additional series: ISM Manufacturing Index, industrial production, aggregate weekly hours of production and nonsupervisory employees in the private sector, the stock market (Wilshire 5000), spot oil prices, and the Treasury yield spread (10-year less 3-month T-bill). The forecasts are run in R with the “vars” package.
TRI: A model that’s based on combining point forecasts, along with the upper and lower prediction intervals (at the 95% confidence level), via a technique known astriangular distributions. The basic procedure: 1) run a Monte Carlo simulation on the combined forecasts and generate 1 million data points on each forecast series to estimate a triangular distribution; 2) take random samples from each of the simulated data sets and use the expected value with the highest frequency as the prediction. The forecast combinations are drawn from the following projections: Econoday.com’s consensus forecast data and the predictions generated by the models above. The forecasts are run in R with the “triangle” package.


Leave A Comment