
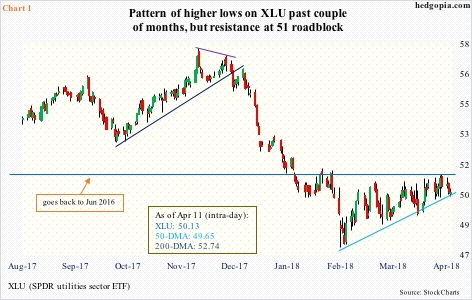
Since bottoming at $47.37 early February, XLU ($50.13) has made higher lows, with the 50-day moving average flattish and the 10- and 20-day flattish to slightly rising. Encouraging if you are a bull, but at the same time, the $51 area continues to be a roadblock.
Last Friday, the ETF retreated after hitting $51. This is where the daily upper Bollinger band lies. After unsuccessfully trying to conquer that resistance several times, the ETF ended down Tuesday and is flat Wednesday with two hours of trading in.

Interestingly in the March 16-29 period when XLU rose 0.7 percent short interest dropped 20 percent (Chart 2). This was an opportunity for the bulls to force a squeeze, and it was wasted.
Near-term, the daily chart is overbought, and there is room for XLU to go lower. Remains to be seen if the 50-day ($49.65) gets defended. A two-month rising trend line is being tested (Chart 1).
The thesis behind a hypothetical trade initiated on January 9 did not quite work out. A January 26 52/51 bull put spread combined with a 52 short put eventually resulted in going long the underlying at $50.94. Worth exiting for a loss.


Leave A Comment