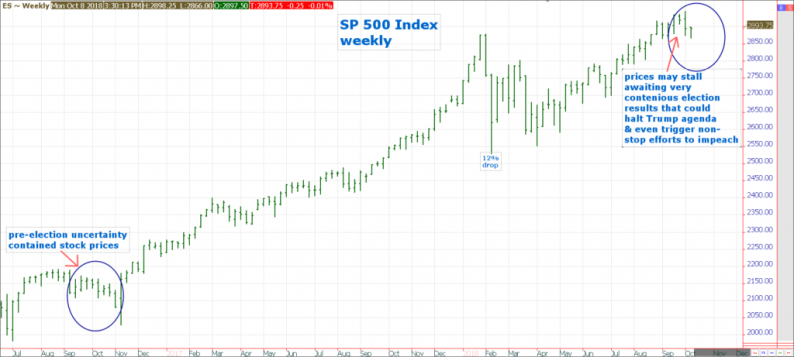
On September 28th we forecasted an October correction with this chart, warning of a parallel to the pre-election pause in October 2016. The uncertainty and contentiousness parallel to 2016 favor sideways to lower stock prices into the November 6th election. A further investment correction scare in November would be likely if Democrats surprise current polls and take control of the Senate. A post-election bounce into year-end is favored if the GOP retains the House and Senate. Until new Buy signals appear, our 2016 parallel along with other measures target an ideal correction range of 3 to 5%. (7% intraday).

While the September top arrived near our time and price window, many indicators of overbought fell just short of triggering a strong Sell point. Option trader Put/Call sentiment and the popular Arms or Trading Index did reach overbought readings. Another clue of trouble for stocks was the reversal in Oil. While our $75 WTI Oil target was exceeded on October 3rd, we were confident stocks and Oil would fall together in October. With support for Oil near $73, it’s likely stocks will become more range bound as Oil stabilizes.

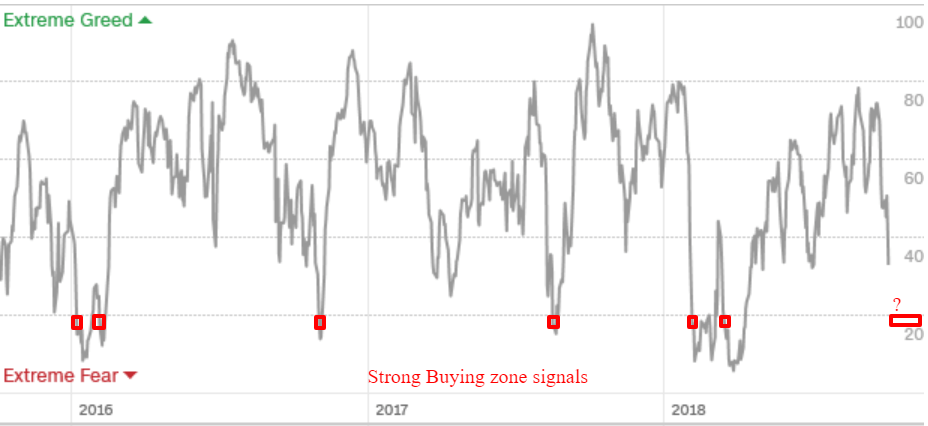
One popular technical measure of oversold readings on the Buy side is the CNN Fear & Greed indicator. It hit 29 today and a breach under 20 is often a good time to add to the stock portfolio.
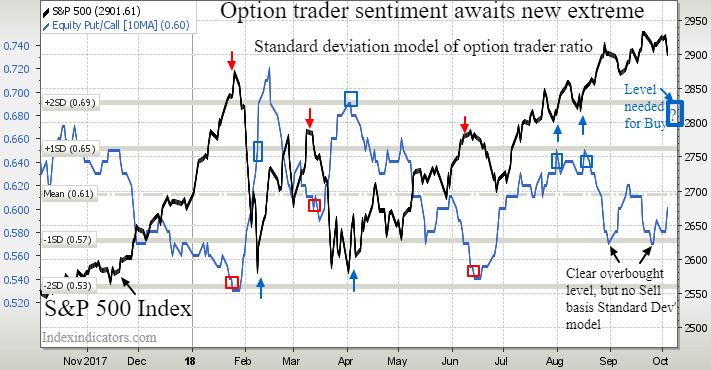
Traders have been consistently buying an excessive amount of Bullish Call options in late August and late September giving contrarian warnings that the stock market could be peaking. While the ideal overly pessimistic Put buying levels shown may not be reached for an upcoming Buy point, we would have more confidence adding stocks if our 67 to 69% 10-day Put/Call ratio is entered. (63% as of 10-08-18)
Our defensive 64% stocks, 36% cash in our investment model reflects the lack of confidence we have in stocks continuing higher until at least November 6th. While interest rates are considered the trigger of the current 2% pullback, it’s likely stocks will not mount another assault on record highs until the breakout in yields begins to reverse. Should the 10 Year yield fall back to test 3.12%, it may signal that stocks have bottomed, but as long as yields probe news highs above 3.2%, we will remain susceptible to selling squalls in the stock market.



Leave A Comment