James Paulsen, chief investment strategist at Leuthold Group, sees trouble brewing in the growing disconnect between US equity sectors. He told CNBC earlier this week that correlations among US equities is unusually low and flashing a warning signal. That’s an especially dangerous sign when the stock market’s valuation is so high. Let’s dig deeper into the topic by crunching correlations on the major sector ETFs along with a broad equity market fund.
But first, the set-up. Paulsen advised:
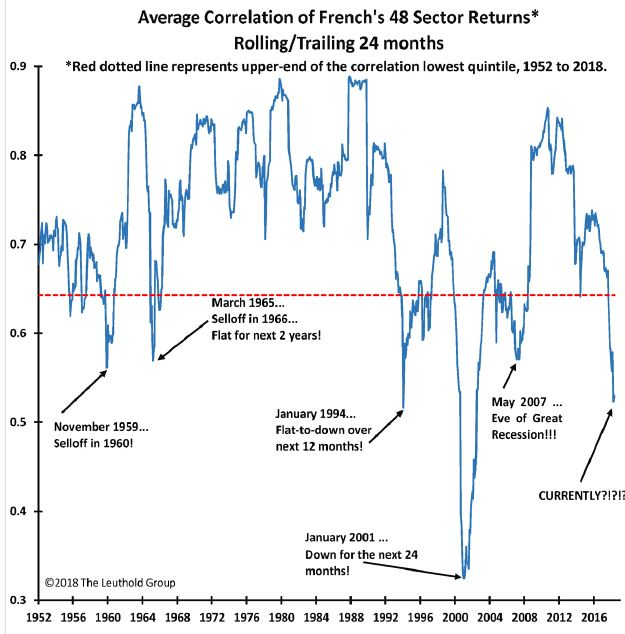
Correlation is at one of the lowest levels in the post-War era. The combination is damaging. We now have record low correlation at the same time we have high valuations, and the combination is bad for the market. When you have this situation of the lowest quintile correlation against the highest quintile valuation since 1952, you have 10 percent declines on average.
Paulsen’s analysis carved the US equity market up into 48 buckets, using data that begins in 1952 with a 24-month rolling window. The chart below summarizes his results.

The low correlation of late, he explained, suggests that a higher percentage of shares are trailing the broad market. The low correlation reading tends to be linked with an aging bull market, Paulsen noted, adding that correlation tends to pop when selling spreads during bear markets.
Let’s see if we can replicate Paulsen’s results in R using a set of sector ETFs and a broad equity market fund. (For an illustration of using R to generate rolling correlations, see this code example here.)
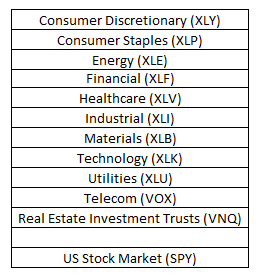
Although the sector ETF histories only go back to the early 2000s, it’s clear that median correlations of the sector funds – defined as the pairwise correlations between the sector funds and vs. the broad equity market – has dropped sharply in recent history, based on a daily returns via a rolling two-year window (504 trading days, or double the standard one-year 252-trading day benchmark) through yesterday’s close (August 9).


Leave A Comment