There are two factors, above all others, which are spooking asset markets at present, inflation and interest rates. The former is impossible to measure with any degree of certainty – for inflation is in the eye of the beholder – and the latter is divergent depending on whether you look at the US or Japan – with Europe caught somewhere between the two extremes. In this Macro Letter, I want to investigate the long term, demand-pull, inflation risk and consider what might happen if stocks, bonds and real estate all collapse in tandem.
It is reasonable to assume that US rates will rise this year, that UK rates might follow and that the ECB (probably) and BoJ (almost certainly) will remain on the side-lines. An additional worry for export oriented countries, such as Japan and Germany, is the protectionist agenda of the current US administration. If their exports collapse, GDP growth is likely to slow in its wake. The rhetoric of retaliation will be in the air.
For international asset markets, the prospect of higher US interest rates and protectionism, spells lower growth, weakness in employment and a lowering of demand-pull inflationary pressure. Although protectionism will cause prices of certain goods to rise – use that aluminium foil sparingly, baste instead – the overall effect on employment is likely to be swift.
Near-term impact
Whilst US bond yields rise, European bond yields may fail to follow, or even decline, if export growth collapses. Stocks in the US, by contrast, may be buoyed by tax cuts and the short-term windfall effect of tariff barriers. The high correlation between equity markets and the international nature of multinational corporations, means global stocks may remain levitated a while longer. The momentum of recent economic growth may lead to increased employment and higher wages in the near-term – and this might even spur demand for a while – but the spectre of inflation at the feast, will loom like a hawk.
Longer-term effects
But is inflation really going to be a structural problem? In an attempt to answer this we must delve into the murky waters of the employment data. As a starting point, at what juncture can we be confident that the US and other countries at or near to full-employment? Let us start by looking at the labour force participation rate. It is a difficult measure to interpret. As the table below shows, in the US and Japan the trend has been downward whilst the UK and the EU are hitting record highs:-
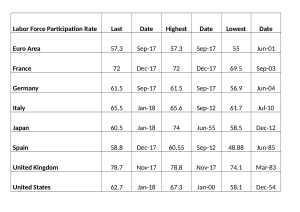
Source: Trading Economics
One possible reason for this divergence between the EU and the US/Japan is that the upward trend in European labour participation has been, at least partially, the result of an inexorable reduction in the scope and scale of the social safety net throughout the region.
More generally, since the Great Recession of 2008/2009, a number of employment trends have been evident across most developed countries. Firstly, many people have moved from full-time to part-time employment. Others have switched from employment to self-employment. In both cases these trends have exerted downward pressure on earnings. What little growth in earnings there has been, has mainly emanated from the public sector, but rising government deficits make this source of wage growth unsustainable in the long run.
The Record of Meeting of the CAC and Federal Reserve Board of Governors – published last November, stated the following in relation to US employment:-
The data indicate that despite the drop in unemployment, there has not been an increase in the number of quality jobs—those that pay enough to cover expenses and enable workers to save for the future. The 2017 Scorecard reports that one in four jobs in the U.S. is in a low-wage occupation, which means that at the median salary, these jobs pay below the poverty threshold for a family of four. For the first time, the 2017 Scorecard includes a measure of income volatility that shows that one in five households has significant income fluctuations from month to month. The percentage varies by state, from a low of 14.7 percent of households in Virginia to a stunning 29.8 percent of households in Wyoming. In addition, 40 percent of those experiencing volatility reported struggling to pay their bills at least once in the last year because of these income fluctuations. These two factors contribute significantly to the fact that almost 37 percent of U.S. households, and 51 percent of households of color, live in the financial red zone of “liquid asset poverty.” This means that they do not have enough liquid savings to replace income at the poverty level for three months if their main source of income is disrupted, such as from job loss or illness. This level of financial insecurity has profound implications for the security of households, and for the overall economic growth of the nation.


Leave A Comment