Many investors purchase stocks with the intent of building wealth for retirement.
One natural question that occurs with regard to retirement planning is “how large should my portfolio be to retire?“
The easiest answer to this question comes from the 4% rule, which states that a retiree should withdraw 4% of their nest egg each year to pay for life’s expenses. 4% is deemed a safe rate, with retirement distributions ideally being composed mostly of dividends and interest payments.
Working backward, an investor can determine the necessary size of their retirement portfolio by multiplying their anticipated retirement expenses by 25x (which is the inverse of 0.04 – four percent).
Whether the 4% rule is accurate or not depends on the returns generated by an individual’s portfolio. If a retirement portfolio returns only 1% per year, then 4% annual withdrawals will inevitably reduce the portfolio’s balance to 0. On the other hand, 20% annual returns will allow the portfolio to continue to grow even with 4% annual withdrawals.
Fortunately, we can empirically test this withdrawal policy by running simulations based on the historical returns in the stock market.
This article will assess the validity of the 4% rule when it is applied to a portfolio of dividend stocks using a Monte Carlo simulation.
Assumptions
As with any statistical analysis, this article makes use of a few assumptions to make predictions feasible. These assumptions will be outlined in this section.
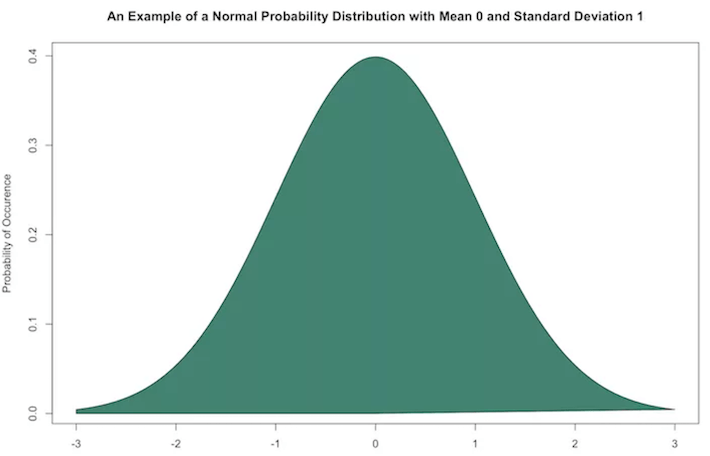
First, stock market returns are assumed to be normally distributed. What this means is that stock market returns are expected to be bell-shaped, centered around some mean with a predetermined standard deviation. The shape of a typical normal distribution can be seen below.

In practice, stock market returns are not really normally distributed. Stock market returns generally contain more outliers than the normal distribution accounts for, which results in the ‘tails’ of the normal distribution being smaller than the real distribution of stock market returns.
This is called the ‘fat tail’ phenomenon and is not ideal because it underestimates the probably of adverse market events like the financial crisis in 2008-2009.


Leave A Comment