
The Australian Dollar is approaching multi-year uptrend support after plummeting nearly 6% off the yearly highs. If the broader uptrend is to remain viable, prices will need to find a low ahead of this key structural support confluence in the days to come. It’s make-or-break here for the Aussie.
AUD/USD DAILY PRICE CHART
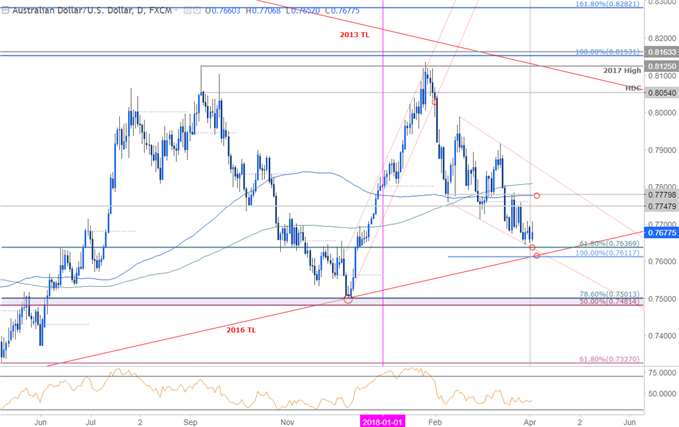
Technical Outlook: In this week’s Technical Perspective, we noted that the Australian Dollar was, “approached a long-term support confluence we’ve been tracking since the start of the year at 7612/37. This region represents a critical inflection point for price and IF broken would risk a substantial sell-off in the Aussie.” Put simply, price is trading just above major uptrend support and we’re on the lookout for an exhaustion low while above 7612.
AUD/USD 240MIN PRICE CHART
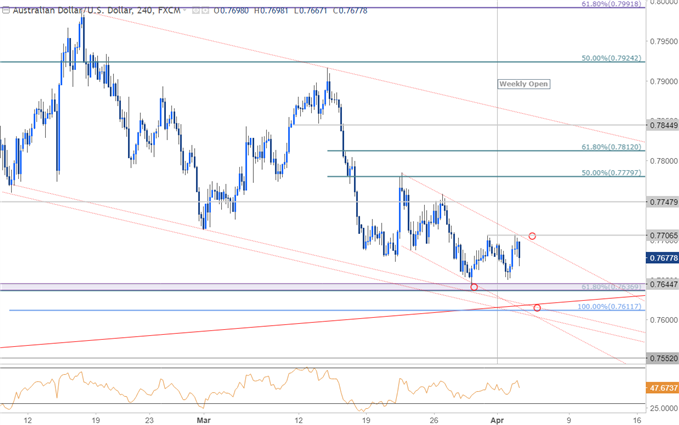
Notes: A closer look at price action see’s Aussie trading within the confines of a descending channel formation with the lower parallels further highlighting support into 7612. A near-term embedded channel keeps the focus lower while below the weekly opening-range highs with a breach above 7707 needed to get things going. Such a scenario targets subsequent topside objectives at 7748, 7780 and the 61.8% retracement at 7812. A break / daily close below 7612 would invalidate the reversal play and keep the short-bias in focus targeting 7552 backed by 7501 & the 50% retracement at 7476.
Bottom line: Be on the lookout for a near-term exhaustion low with 7637 & 7612 both representing key zones of interest. From a trading standpoint, I’ll favor fading weakness into this support confluence with a breach above channel resistance needed to validate a near-term reversal. Ultimately, this is a BIG level for Aussie and a break below could prove terminal to the multi-year uptrend – tread lightly until we get some convincing near-term price action.


Leave A Comment