In commodity markets backwardation is an indicator of physical shortages. Shortages result in buyers bidding up the cash price of the commodity above the future prices. This creates a profitable trade (called decarry) for those holding the physical commodity – they can sell it now and buy a futures contract at a lower price, locking in a profit.
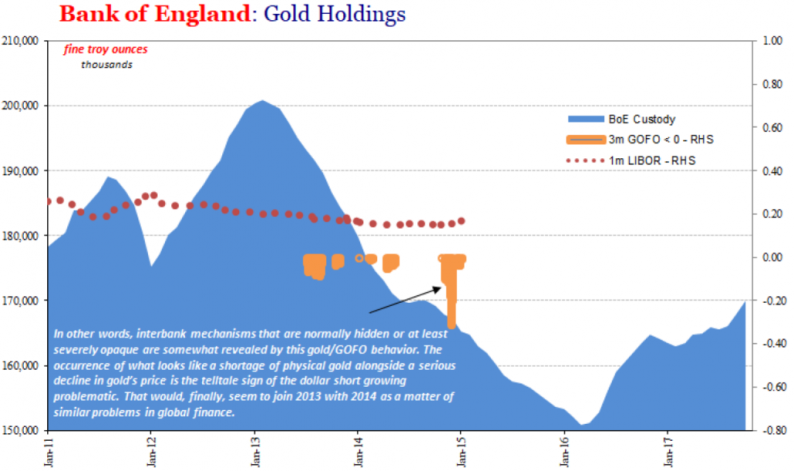
backwardation should, therefore, be associated with rising prices. However, in a recent Macro Voice podcast, guest Jeffrey Snider noted the anomalous situation in the gold market between 2013 and 2016 where negative gold forward rates (GOFO) indicated backwardation while the gold price was falling. Jeffery’s chart below shows periods where the LBMA GOFO rate was below zero, along with the Bank of England’s custody holdings (gold held on behalf of central banks and bullion banks).

Jeffery sees this unusual situation being related to the Eurodollar market:
“Whenever I see the forward rate go negative, and we see gold disappear from official stores, that tells us that there is a funding problem, a collateral problem, in these global Eurodollar markets.”
Unfortunately, Jeffery’s chart stops at January 2015, as the LBMA discontinued publishing GOFO due to increasing regulatory costs associated with operating a benchmark. Fortunately, Monetary Metals has developed MM GOFO™, a market-derived replacement rate with a very high correlation to the historical LBMA GOFO.
The chart below shows the Bank of England holdings along with the gold held by the US ETF GLD against the times the MM GOFO 3m rate is below zero.
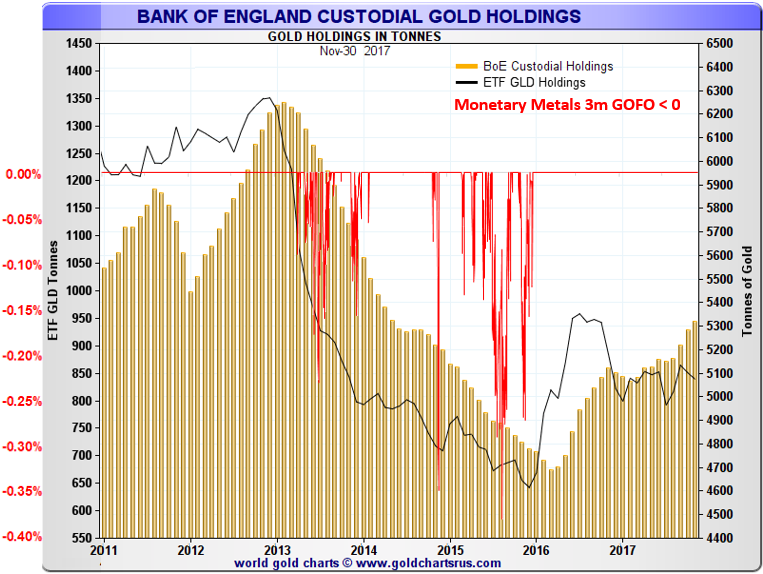
The first time MM GOFO goes negative is April 12, 2013, and again on the 23rd but it is not until mid-May that the rate moves into solid negative territory. It is as this point that a significant amount of gold at the Bank of England starts to be withdrawn. When MM GOFO returns to positive in mid-2014, the Bank of England holdings stabilize but then fall again once MM GOFO drops below zero for the second time.


Leave A Comment