
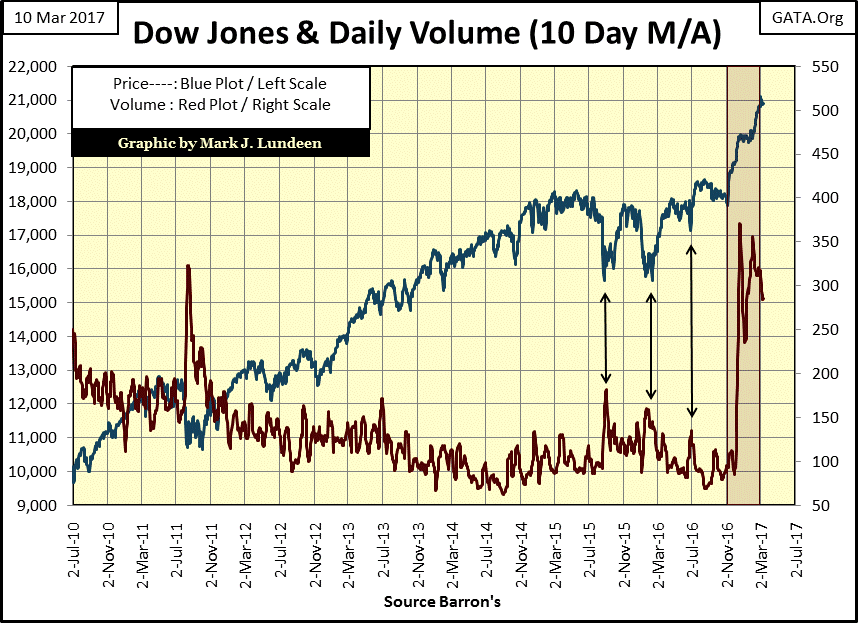
The stock market, as measured by the Dow Jones seems to be at an inflection point. It hasn’t seen a new all-time high since March 1st. And for what it’s worth, trading volume (market demand) for the 30 blue-chip companies contained in the Dow Jones is falling off. It needs to be noted that until just last November, the Dow Jones had been defying the law of supply and demand for the better part of two decades.
Since January 2000 the Dow Jones has been rising on falling volume, and declining on rising volume. There’s no mystery here; the “policy makers” via monetary inflation from the FOMC, were supporting the market during market declines, and withdrew their support on market advances. It’s the old “Greenspan Put” in action.
If basic economic laws are once again to apply to the Dow Jones, as was the case from January 1900 to January 2000 (100 years), should trading volume continue declining, it will not support the Dow’s current market values as we move further into the year.
But this all rests on the speculation that for the first time since January 2000, the “policy makers” will do nothing as the Dow Jones experiences a double-digit percentage decline. With Donald Trump now sitting in the Oval Office, I wouldn’t be surprised if this is exactly what the FOMC intends on doing, as they, and everyone else in Washington, thinks long and hard on how best to impede the Trump administration’s efforts to drain the swamp in Washington.
The Dow Jones closed the week 1.01% from its last all-time high of March 1st. But on Wednesday it closed 1.23% from it; just short of the halfway point between the 0.00% and -2.50% lines. That’s interesting. This was the furthest from a BEV Zero (a new all-time high) the Dow Jones has found itself since the beginning of last November (four months), as seen in the circle in the BEV chart below.
I’m not expecting the beginning of a stock market crash next week as a result of what happened last Wednesday. However, understanding this event as signaling the turn in the tide of the tsunami of “liquidity” flowing into the stock market since the presidential election isn’t an unreasonable assumption to make. If sometime next week the Dow Jones closes nearer to its BEV -2.50% line below than its BEV Zero line, something greater than -1.50% from its last all-time high of March 1st, I expect the stock market is signaling a significant correction, the first in over a year.
The table in the Dow’s BEV table below shows the dollar declines required for the Dow Jones to break below the listed BEV lines. A 10% correction in the BEV chart below would take the Dow Jones down to 19,000, a 2,111 point decline from its last all-time high of March 1st.

Looking at the NYSE 52Wk Highs and Lows supports this view; that the flood tide has turned to an ebb tide in the past few weeks. Below is the chart for the NYSE 52Wk High-Low Ratio. The data points are computed by taking the daily net of the NYSE 52Wk High – 52Wk Lows, and divide that by the number of shares traded at the NYSE that day.
Looking at the last 20 years in the ratio, one thing is made very clear; fear is a more powerful emotion in the market than is greed. Since January 1996, the ratio has breached its +20% line only once (April 2010). But breaking below its -20% line is common in market declines.


Leave A Comment