Over the past two months, we’ve warned repeatedly that global asset prices may be set up for a correction once the flow of central bank liquidity ebbs.
Between the Fed feeling “behind-the-curve-ish,” Draghi pondering a taper and more recently considering hiking ahead of said taper, and rumors that the BoJ’s JGB buying scheduling will leave Kuroda short of his target, it appears increasingly likely that the ~$400 billion/quarter CB liquidity put will soon vanish.
As Citi’s Matt King recently wrote:
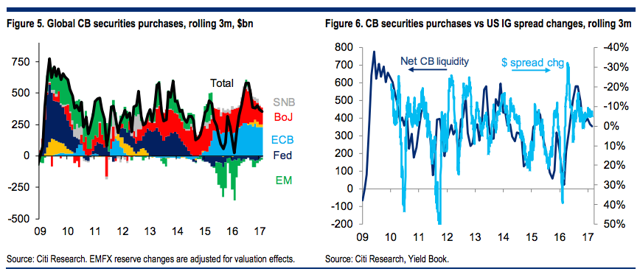
While the scale of CB purchases over the past half-year or so has been close to record highs, it is already diminishing, and set to diminish further (Figure 5).

Well in case you had any questions about the extent to which it’s the “flow” (not necessarily the “stock”) of central bank liquidity keeping this clown mobile running, consider the following out Tuesday from BofAML…
Via BofAML
And as the below charts show, in periods where global QE has been at its most potent (i.e. global central bank balance sheets have grown strongly), this has tended to corresponded with rallies in both global high-yield spreads (chart 5) and equities (chart 6), although less so with the latter as central banks have not been directly buying stocks.

So take a good hard look at the chart in the left pane. Then think about this:

And this:


Leave A Comment