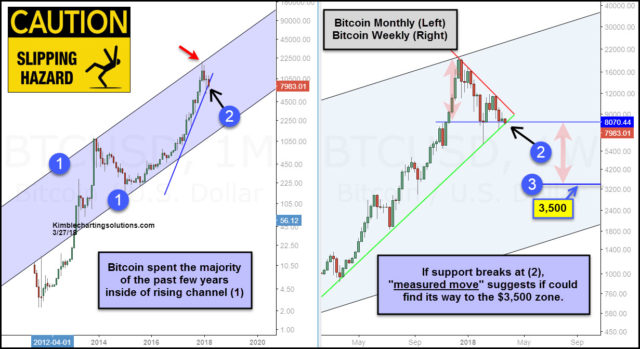

Above looks at Bitcoin on a monthly and weekly basis. In the left chart, Bitcoin Monthly has spent the majority of the past 5-years inside of rising channel (1). It hit the top of the channel late last year, where it created a large bearish reversal pattern (bearish wick) and prices started immediately heading lower.
Over the past few months, the weekly chart highlights that Bitcoin could be forming a bearish descending triangle with support coming into play at (2). Roughly two-thirds of the time when this pattern forms, the asset falls in price.
Both charts reflect that a support test is in play at (2). If support would give way at (2), the “descending triangle measured move” suggests that Bitcoin could head towards the $3,500 level at (3).
The Power of the Pattern believes that the support test at (2) is the most important support test for Bitcoin in the past 5-years!
What do bulls want to see? Bulls would love to see support hold and falling resistance taken out, which would break the bearish descending triangle pattern.


Leave A Comment