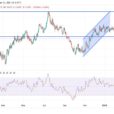
The Bitcoin price continues to fall and could eventually test its last low around $7,240, which would likely confirm the appearance of the bearish chart pattern known as the death cross. So why is bitcoin refusing to rebound? Experts are quick to offer suggestions, including everything from Twitter’s recent crackdown on cryptocurrency ads to continuing jitters over the possibility of regulation. However, not everyone sees the recent sideways trading as a bad thing.

vjkombajn / Pixabay
Technical cues from the bitcoin price chart
At the time of this writing, the bitcoin price is hovering below $8,000, trending in the $7,800 to $7,900 range with often brief peaks above $7,900. Unfortunately for those trying to make heads or tails of the technical indicators around the bitcoin price, deciphering them could prove to be a challenge. Then again, volatility is nothing new when it comes to cryptocurrencies.
Newsbtc suggests the bitcoin price chart could be set up for a further pullback, noting that it was trading inside a descending channel on the one-hour price chart. The 100-day simple moving averaged crossed below the longer-term timeframe, which suggests that further declines seem more likely than a new rally. The gap between these levels is widening as well, which suggests that the bears are gaining more and more control over the bitcoin price.
Newsbtc doesn’t entirely rule out a rally either, as the stochastic indicator suggests a bounce from oversold levels as the price tests key support levels, which could mean that the bitcoin price will rise back to Fibonacci retracement territory. According to Newsbtc, the 100-day simple moving average matches the 50% Fibonacci retracement at the $8,400 level, which could make that another line of resistance for the bitcoin price. Meanwhile, the 200-day simple moving average lines up with the high end of the retracement, so that could end up signaling a correction.
A death cross is forming on the bitcoin price chart


Leave A Comment