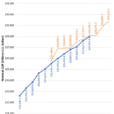
If you are investing in either Bitcoin or Gold, it’s important to understand which one asset is behaving more like a bubble than the other. While it’s impossible to understand how the market will value these two very different assets in the future, we can provide some logical analysis that might remove some of the mystery associated with Bitcoin versus Gold.
I’ve read some analysis on Bitcoin profitability and energy consumption that may be unreliable, so I thought I would put my two cents in on the subject matter.
For example, many sites are using the Digiconomist’s work on Bitcoin energy consumption. However, I believe this analysis has overstated Bitcoin’s energy consumption by a large margin. According to the Digiconomist, Bitcoin’s annual electric use is approximately 24 TerraWatts per year (TWh/yr):
![]()
In a recent article that was forwarded to me by one of my readers, How Many Barrels Of Oil Are Needed To Mine One Bitcoin, the author used the information in the chart above to calculate the energy cost to produce each Bitcoin. He stated that the average energy cost for each Bitcoin equals 20 barrels of oil equivalent. Unfortunately, that data is grossly overstated.
If we look at another website, the author explains in great detail the actual energy cost to produce each Bitcoin. According to Marc Bevand, he calculated on July 28th, that the average electric consumption of Bitcoin was 7.7 TWh/yr, one-third of the Digiconomist’s figure. Here are two charts from Marc Bevand’s site showing how he arrived at the figures:

This graph shows the increase in Bitcoin’s hash rate and the efficiency of the Bitcoin Miners at the bottom. If you want to read more detail of the analysis, I suggest you click on the link (Marc Bevand: According to Marc Bevand)

The second chart shows the Bitcoin energy consumption analysis on Feb 26th at a Best Guess (average) of 4.12-4.73 TWh/yr. However, Marc updated the data again on July 28th, as the hash rate increased, to show total Bitcoin energy consumption rose to 7.15-8.27 TWh/yr. I took the average of his range to be 7.7 TWh/yr.
Nonetheless, I had to update the number again because it has been three months since Marc calculated his figures.I decided to increase the 7.7 TWh/yr rate by 45% to account for three months and to get us up to date. I arrived at the 45% figure by using the 75% increase in Marc’s energy consumption figures from Feb to July. His energy consumption figures increased approximately 15% per month. Thus, three months equals 45%.


Leave A Comment