
Cryptocurrencies are crashing across the board and the leading coin, bitcoin, is not immune to the fall. Why is the sell-off occurring? Here are 5 reasons for the crypto-crash.
Bitcoin is not suffering the worst crash, but as the leading digital currency, it enjoys the highest volume and its recent moves offer technical levels of support and resistance we can look at.
BTC/USD is trading around $13,400, which provided support to the coin earlier this month, thus serving as support. The battle to hold onto this line continues after the fall of 15% on the day so far.
Here is the chart, with descriptions of the lines following below.
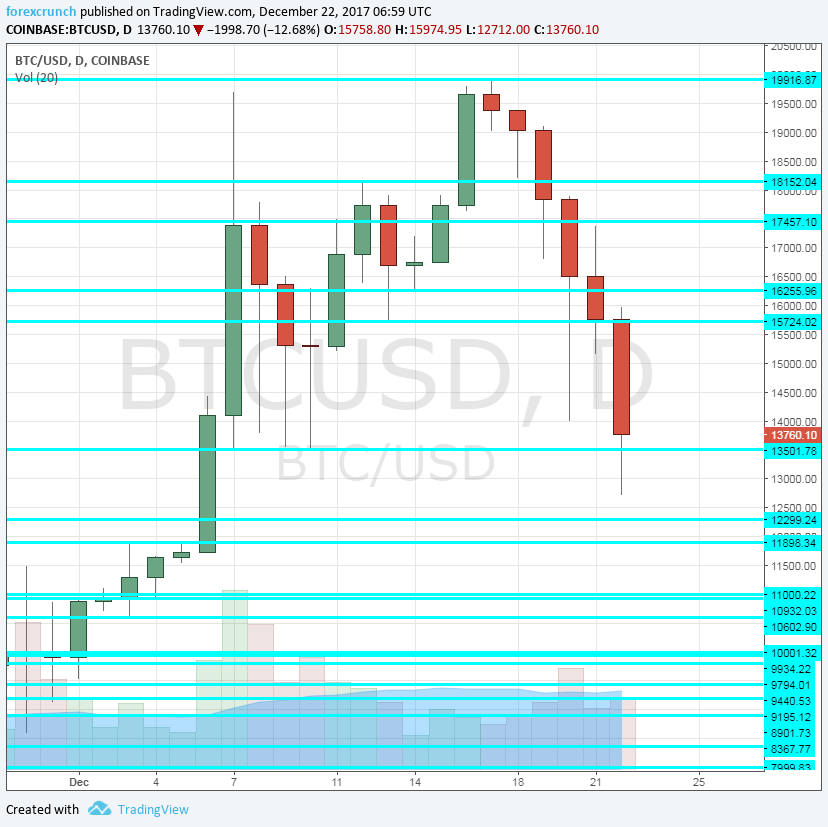
BTC/USD support lines
If BTC/USD fails to hold onto $13,400, the next line of support is at $11,900. The price stalled at this point before making the big leap towards $20,000.
The round level of $10,000 is clearly of high psychological importance, but real technical support awaits only at $8,600. BTCUSD was unable to break above this level during long days in late November. After the breakout, a correction sent it to test this line. It did not break lower, and then continued to much higher ground.
The last line, for now, is $5,400. This is a line of support from mid-November, but may be too far out for now.
BTC/USD resistance lines
If the battle over $13,400 is won to the upside, there is a lot of room there. $16,000 may serve as a temporary cap, but a clearer line of resistance is $18,135. This level capped the digital currency last week.
The ultimate level of resistance is $20,000, just above the peak of $19,964. It is also a round number, magnifying its significance.
Will bitcoin continue suffering or will it enjoy a Santa rally over the long Christmas weekend?


Leave A Comment