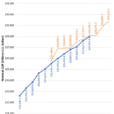
Every month, the NY Fed conducts a survey of consumer expectations. The lead chart is from the Fed, I created the others
The New York Fed Survey of Consumer Expectations shows “Consumers’ Expectations Largely Stable; while Home Price Growth Expectations Continue to Retreat”.
Year-ahead inflation expectations remained steady at 3.0 percent over the month while three-year-ahead expectations ticked up by 0.1 point to 3.0 percent. Expectations about household income and spending growth were stable at 2.8 percent and 3.2 percent, respectively. Home price growth expectations retreated by 0.1 point to 3.6 percent since July, while expectations about the growth in government debt rose sharply to 7.9 percent, up from 6.9 percent in the prior month, marking the highest such reading since November 2015.
One can download the survey data and create better-looking charts. Here are a few charts I created.
One Year Ahead Household Income Projections
?
One Year Ahead Household Inflation Projections
?
One Year Ahead Household Spending Projections
?
Income Synopsis
25 Percent Level: 0.92% Income Increase
Median: 2.81% Income Increase
75 Percent Level: 5.88% Income Increase
Inflation Synopsis
Spending Synopsis
25 Percent Level: 0.69% Spending Increase
Median: 3.15% Spending Increase
75 Percent Level: 8.28% Spending Increase
Assumptions
Conclusions
Assuming assumption number two is correct, low end seems desperate to hold the line on spending while expecting low income growth.
The median household expects to spend a little more than they take in, and very near the median inflation exception as well.


Leave A Comment