
In early February, the markets experienced some turmoil. Volatility spiked, stocks sold off roughly 10% and credit spreads widened. These were strange events given that over the prior 15 months the total return for the S&P 500 was positive each and every month. From November 2016 through January 2018, stocks and most other risky assets enjoyed a historic run of positive performance where temporary downturns were very limited. There are a lot of explanations for this, ranging from the policy agenda of President Trump to synchronous global growth. Rather than guess, and with the streak of consecutive positive months now broken (February closed down -3.69%), we thought it an opportune time to evaluate some of February’s dynamics to draw reasonable conclusions about where we might be headed next.
Valuation Comparison
The U.S. equity markets are not simply on a strong performance run, they are currently leading the world in valuations. The chart below highlights a sample of equity markets from various countries in a unique light. As opposed to return performance, this chart illustrates the 1-year forward price-to-earnings ratio (PE) as compared to the distance of that ratio from the peak since 2007. The markers on the chart correspond to the country below them in the table at the bottom. The crimson marker at the far bottom right is the S&P 500.

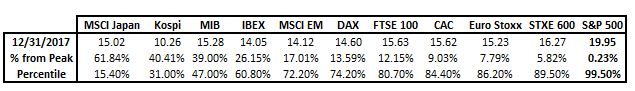
Although several countries are less than 15% away from the peak, as of December 31, 2017, the S&P 500 was sitting at peak levels. Despite the volatility of the past few weeks, these numbers have not changed very much and the U.S. remains the global valuation leader.
Reasons
It is difficult to attribute what we are observing to Donald Trump’s election as the 1-year forward PE on the S&P 500 has been the highest in the world since well before his surprise election victory. It is possible U.S. equity market leadership is due to expectations for comparatively stronger earnings growth. However, even that logic does not reconcile with the data. According to Robert Shiller, current S&P 500 real earnings per share (adjusted for inflation) are only 6.4% above their 2007 peak. Meanwhile, the value of the S&P 500 index (adjusted for inflation) is over 38.3% higher in the same time frame.


Leave A Comment