
Following futures positions of non-commercials are as of March 13, 2018.
10-year note: Currently net short 271.4k, down 90.8k.
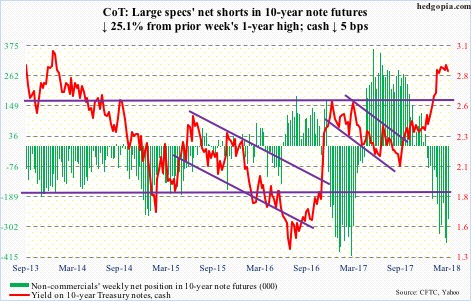
Once again, 10-year Treasury yields are retreating from important resistance. Caught in a three-decade-old descending channel, the 10-year rate came very close to breaking out, rising to 2.94 percent on February 21. This was preceded by a relentless rally from 2.03 percent on September 7 last year.
Fatigue may have set in at an important juncture.
In the right circumstances, the weekly chart has plenty of room to head lower. Economic growth is in deceleration, and this can impact these yields.
Near-term, though, it is looking like a coin toss. Yields this week found support at the daily lower Bollinger band, even as the daily chart is beginning to look oversold.
Whatever happens near term, a crucial test likely lies ahead. In due course, a breakout retest of 2.62 percent looks imminent. This was a level reached in December 2016, and then again in March 2017, before it was taken out in January this year. What happens around this level will dictate price action for the foreseeable future.
Non-commercials cut back this week, but they are still heavily net short. This is a potential source of headwind for yields (cash), should these traders continue to cover.
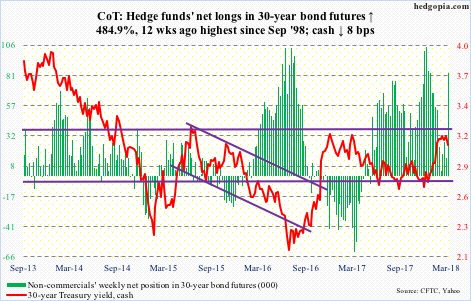
30-year bond: Currently net long 83.6k, up 69.3k.
Major economic releases next week are as follows.
FOMC meeting – the year’s second – begins Tuesday, and ends the next. A 25-basis-point hike is priced in. Markets are probably more focused on what the dot plot conveys.
Post-December 2017 meeting, members expected three hikes this year. After January’s employment report, which at the time showed average hourly earnings rose by a faster-than-expected 2.89 percent, some market participants began to even toy with the idea of four hikes. Two weeks ago when February’s numbers were reported, the January increase was revised down to 2.77 percent, with February only up 2.61 percent. Depending on how the members view this, as well as recent uptick in inflation and inflation expectations, the dot plot can change – may even have an upward bias. Hence its significance for the markets, which are yet to price in four hikes.
Existing home sales for February come out Wednesday. Sales in January fell 3.2 percent month-over-month to a seasonally adjusted annual rate of 5.38 million units. Last November’s 5.72 million was the highest since 5.79 million in February 2007.


Leave A Comment