A fresh 2018 high, an unbroken resistance and negative divergence. What does this interesting mix tell us about oil bull’s strength and further increases?
Technical Analysis of Crude Oil
Let’s examine the charts below (charts courtesy of http://stockcharts.com).

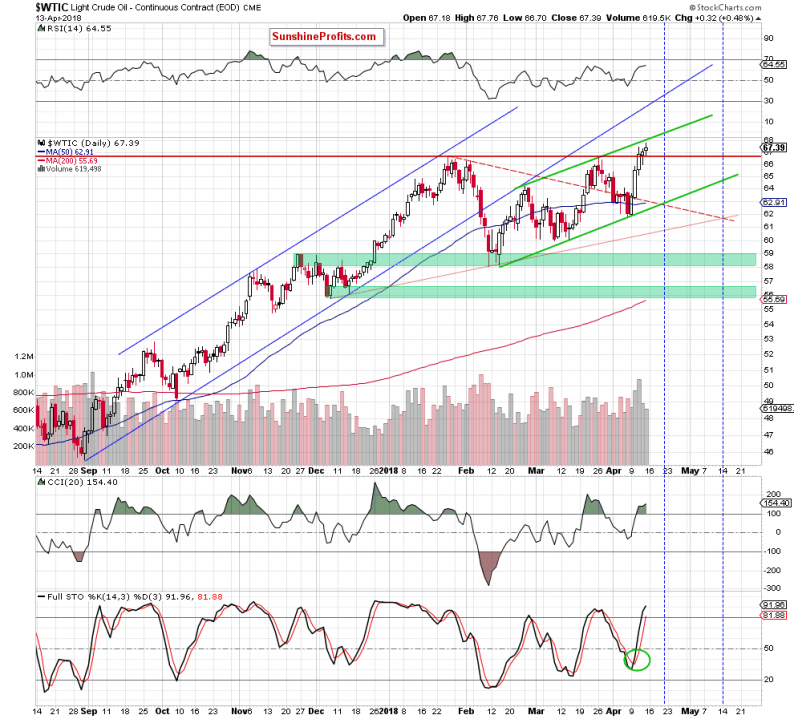
The first ting that catches the eye on the daily chart is a fresh 2018 peak created on Friday. Is this a positive sign? Yes. Is it bullish? In our opinion, not as bullish as it may seem at the first glance.
Why? Although black gold hit a new peak (only 21 cents higher than Wednesday’s intraday high), it is still trading under the upper border of the green rising trend channel.
Additionally, the shape of Friday’s candlestick doesn’t look encouraging (but only from the buyers’ point of view). For those who read our analysis for the first time, we would like to explain here what spool means for the trend. If this candlestick is drawn on the market, it means that the forces of the bulls and the bears have leveled out, and the market has lost strength for further increases (as in our case) or decreases.
However, the spool formation itself is not a strong prognostic formation. It should usually be confirmed by more candles. If the spool appears in the uptrend, the next black candle should appear to confirm the formation. Will we see it in the coming days?
Bearish Signs on the Horizon
Looking at the volume, such scenario seems very likely, because although light crude hit new high, Friday’s upswing materialized on the smallest volume in whole week, which doesn’t confirm oil bulls’ strength.
On top of that, the CCI and the Stochastic Oscillator climbed to their overbought areas, which suggests that we can see sell signals in the very near future. Additionally, there is also a bearish divergence between the price of black gold and the CCI, which increases the probability of reversal in the very near future.


Leave A Comment