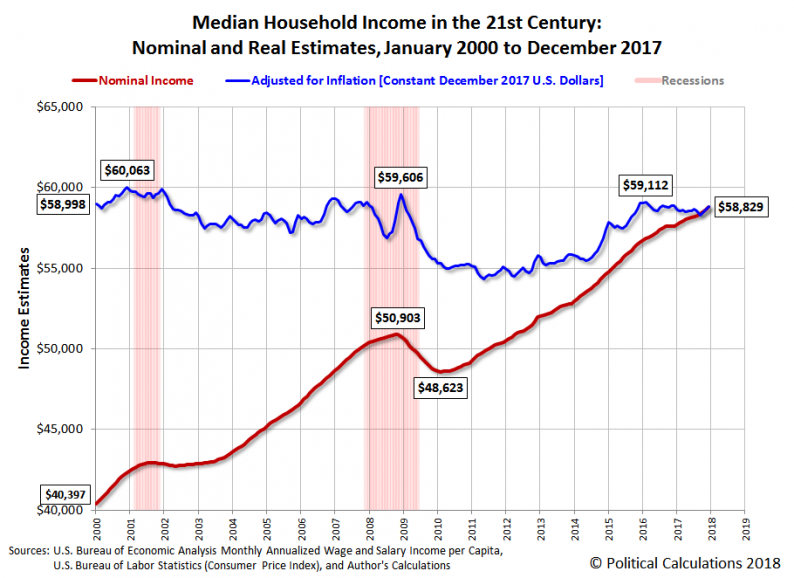
Median household income in the U.S. rose to an estimated $58,829 in December 2017, an increase of 0.15% from our November 2017 estimate of $58,741. The following chart shows our estimates for the trends for both nominal (red) and inflation-adjusted median household income (blue) from January 2000 through December 2017.

In nominal terms, which provide perhaps the best indication of the state of the U.S. economy for typical American households, we find that the pace of growth of median household income has turned up in the period from September through December 2017, after having been in a decelerating trend since mid-2014.
After adjusting the monthly nominal household income estimates for inflation, so that they are expressed in terms of constant December 2017 U.S. dollars, we also find an uptick in so-called “real” median household income in recent months, which has come after this measure dipped sharply from July to September 2017. This period coincides with the impact of Hurricane Harvey and Hurricane Irma, which caused a short term spike in the prices of consumer goods and construction materials in Texas, Florida and in other states along the gulf coast, which has since largely dissipated.
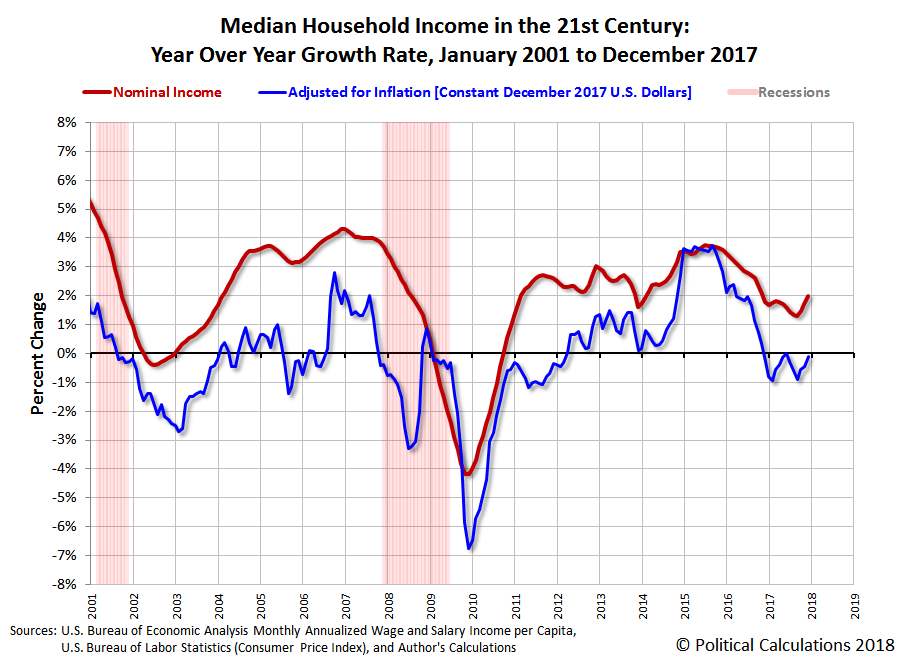
These recent trends are easier to see in the following chart, where we have presented the year over year growth rate of median household income in the U.S. in the period from January 2001 through December 2017.
The methodology for the approach we’ve developed to generate these median household income estimates is described here. In generating inflation-adjusted portion of the Median Household Income in the 21st Century chart above, we’ve used the Consumer Price Index for All Urban Consumers (CPI-U) to adjust the nominal median household income estimates for inflation, so that they are expressed in terms of the U.S. dollars for the month for which we’re reporting the newest income data.
Analyst’s Notes


Leave A Comment