My Trading Journal for the DJIA Today:
Nasdaq still doesn’t look so bad, Russell index does look pretty rough, the S&P 500 is giving up all of Wednesday’s market rally, but the DJIA managed to hold that 10-day moving average with a three day pullback that was quite shallow in nature. If it holds, who knows, maybe a 3x Dow ETF could come into play and provide a nice risk-reward opportunity for traders. But it will need to show a clean bounce off of the 10-day MA for that to happen.
I’ve been harping on this indicator quite a bit lately, but it bears mentioning: the T2108 is looking disastrous. It broke through key support at 50% which was established on multiple occasions in January and February. This time it didn’t work and it broke through to the downside and now only 49% of stocks are trading above the 40-day MA. I’m not going to post a chart on it tonight, because I plan on doing a full dedicated post on it tomorrow.
But the T2108 is acting in a manner that is very similar to August of 2015 when the market spent much of the year trading sideways while the indicator deteriorated rapidly under the surface. This has me questioning the further legitimacy of the bull rally, but at this point, I will not rule out the rally continuing still for a time going forward. Just be aware of the deteriorating conditions.
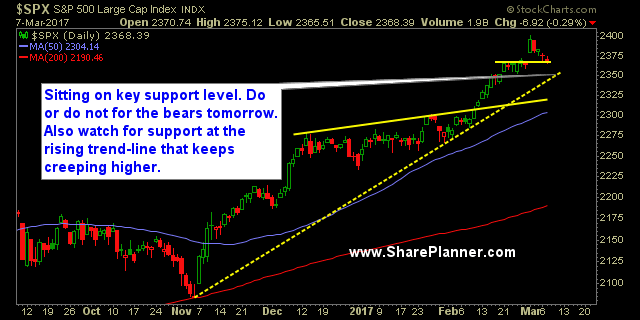
S&P 500 Chart

Current Stock Trading Portfolio Balance:


Leave A Comment