
This chart looks at the Dow Jones Industrials Average and the Yield on the 10-year note on a monthly basis for several decades.
The top chart looks at the Dow since 1927 and the bottom chart looks at yields since 1994.
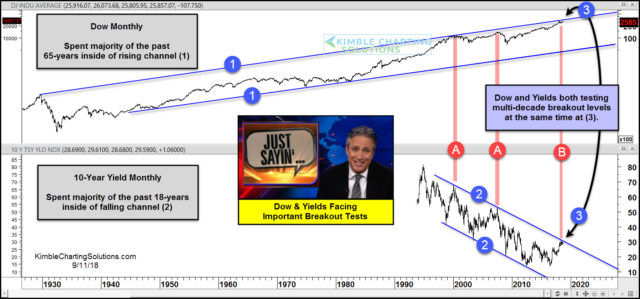
The Dow has spent the majority of the past 65-years inside of rising channel (1) while yields have spent the majority of the past 18-years inside of falling channel (2).
The Dow and Yields are both testing breakout levels at the same time at each (3).
The last two times each faced channel breakouts at the same time was 2000 and 2007 at each (A), where each happened to peak.
Just Saying; Both are testing key breakout levels at the same time!!! Should breakouts take place, a strong bullish message to stocks and bearish for bonds!


Leave A Comment