
This week we’ll dig deeper into the SPX and sector funds and will split the analysis into two parts.
Saturday: SPX, interest rates and sector spiders.
Sunday/Monday: Oil, Gold and G6 currency pairs.
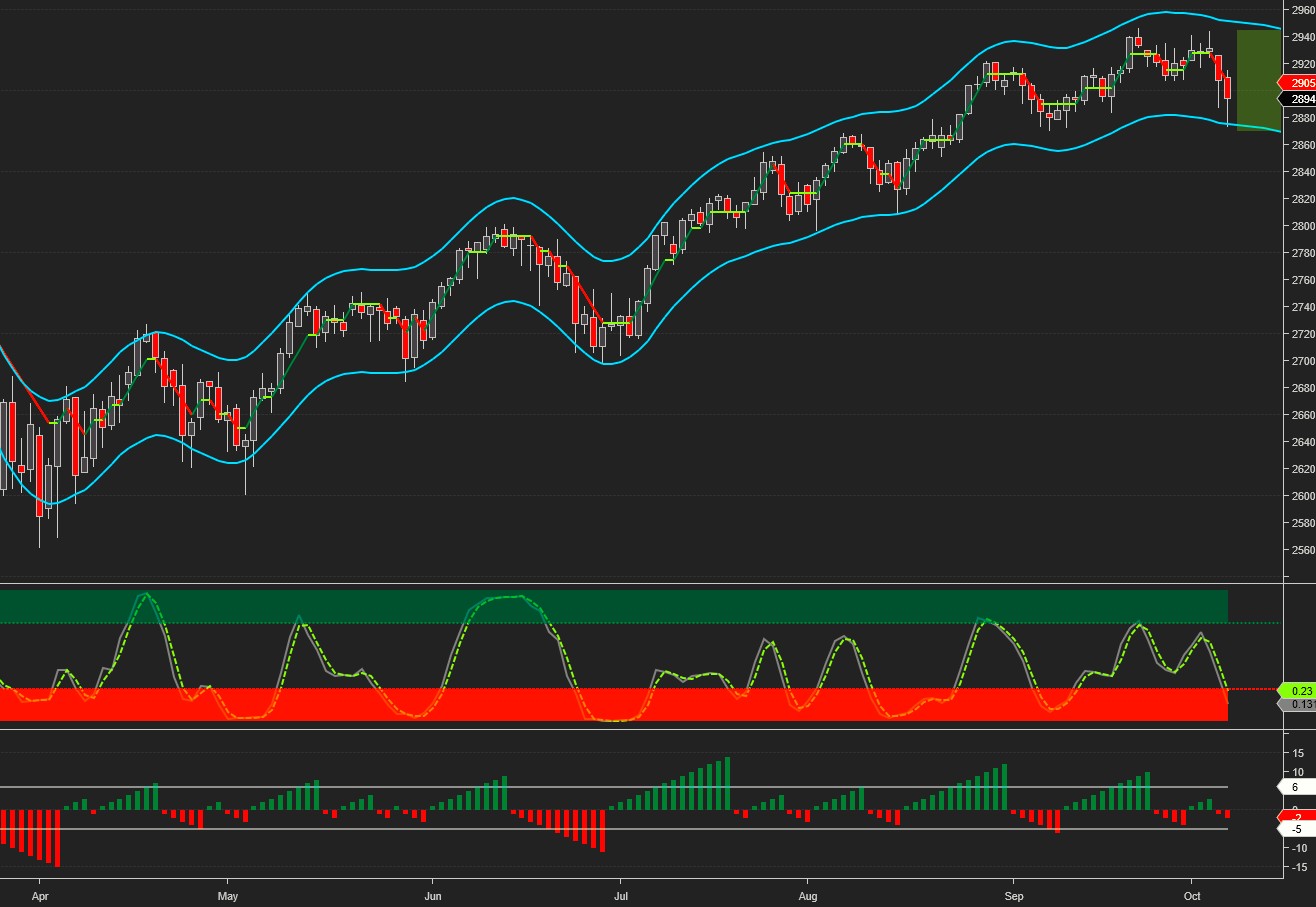
The SPX reached our weekly downside target on Friday and staged a late day rebound. More importantly, however, despite the pull-back it finished the week above 2880 and above the January highs.
For reader convenience, we’re adding the current weekly and daily swing trading signals. Please note that these signals are in effect as of the close on Friday and may change as soon as the markets re-open. Also, keep in mind that these are short-term swing signals, and one should never lose track of the long-term trend and the higher time frame signal.
The CIT SAR signals are based on the interaction between price and angles drawn from swing highs and lows. On the chart they are color coded as green/buy, red/sell and yellow/hold. When the current signal is hold, we also include the preceding buy or sell signal (e.g. Buy/Hold or Sell/Hold). Hold signals followed by a buy/sell signal in the direction of the preceding buy/sell signal can be considered for pyramiding the position.
Current SPX signals: Daily Sell, Weekly Sell, Monthly Buy/Hold
Average up/down swing duration daily: 6/5, weekly: 7/3
Average up/down swing gain/loss daily: 1.62%/-1.7%, weekly: 3.91%/-2.12%
Monthly CIT pivot for SPX at 2916, S1 – 2878, R1 – 2953
The next SPX CIT date is October 9.
The projected trading range for next week for SPX is 2870-2945:
The SPX sell-off was attributed to sharply rising interest rates.
The chart below points to a 3.33 short-term and 4.15 long-term 10 year yield target:

Next, we’ll focus on sector spiders and when their downturns occurred in 2000 and 2008 relative to the SPX.
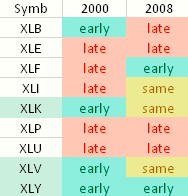
To summarize, in 2000 the XLB, XLK, XLV and XLY turned down before the SPX, while in 2008 the downturn was led by XLF and XLY.


Leave A Comment