

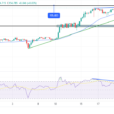
VIX has bounced from its mid-Cycle support at 15.45 this week to test the Cycle Top resistance at 23.93. A buy signal was given last Thursday. The current period of strength may last through the weekend. ZeroHedge comments on the VIX.

The NYSE Hi-Lo Index has been closing under 0.00 for the past week.confirming the NYSE sell signal. Today’s number is sure to be revised lower after the final numbers are calculated. The ETFs double count stocks, so they must be recalculated after the close, since passive ETFs tend to “average up” in down markets…until they don’t. A similar practice was used leading up to the crash in 1929 with mutual funds.
(Bloomberg) The number of market indexes now exceeds the number of U.S. stocks. Traditional ones such as the S&P 500 are collections of securities weighted by market value, and index funds mimic them as a low-cost way to deliver the market’s performance. Many new indexes are different: They include stocks based on custom criteria, such as having low volatility or high dividends.*
What drove the jump?
Demand. Many new benchmarks essentially repackage active investment strategies into indexes, says Eric Balchunas, senior exchange-traded fund analyst at Bloomberg Intelligence. They can then be tracked by so-called smart-beta ETFs, which fund companies are rolling out rapidly.

SPX slipped beneath its 2.5-year Ending Diagonal trendline, suggesting the decline may go further than anticipated by most analysts. An Ending Diagonal is a formation that may be completely retraced. The trigger event is a crossing of the lower Diagonal trendline. The smaller Ending Diagonal formation anticipates a decline to 2532.69. The larger Diagonal formation anticipates a decline to 1810.10.
(Bloomberg) U.S. stocks tumbled the most since February as fresh concern about the impact of the trade war with China roiled technology and industrial shares. Treasuries rose with the yen amid demand for haven assets.
The broad selloff took the S&P 500 to the lowest in three months, the Dow Jones Industrial Average plunged as much as 836 points and the Nasdaq 100 Index tumbled more than 4 percent for its worst day in seven years. All 30 members of the blue-chip index retreated, with Boeing and Caterpillar dropping at least 3.8 percent. Computer companies led the S&P 500 to a fifth straight loss, the longest slide since Donald Trump’s election win.

NDX fell through its uptrend line to its 200-day Moving Average at 7035.25. This is the line in the sand that held up the rally since June 2016. A break here says that the uptrend is over. ZeroHedge adds additional comments on the after-ours session.
(CNBC) Technology stocks got clobbered on Wednesday, suffering their worst day in more than seven years, as concerns over rising interest rates punished the overall market, particularly shares of companies that have been the best performers.
The S&P 500 Information Technology Index closed at $1,220.62, down 4.8 percent, marking the biggest decline since August 18, 2011, when the index dropped 5.3 percent. All 65 members of the index fell. The broader S&P 500 dropped by 3.3 percent and the Dow Jones Industrial Average tumbled 3.2 percent.
The tech sector includes the largest companies by market cap in the U.S. and those that have been the biggest contributors to the extended rally. Shares of Apple, Microsoft and Amazon are up sharply for the year as investors bet they will continue to deliver strong earnings growth and take market share.

The High Yield Bond Index halted its rally on Tuesday, then fell nearly 5% on Wednesday. A sell signal may have been made as it declined beneath its Cycle Top support at 206.44. A further decline beneath Intermediate-term support at 202.56 may confirm the sell signal.
(ZeroHedge) Last week, the euphoria over US high yield bonds hit new post-crisis highs when amid a sharp slowdown in supply, a rise in the oil price and generally solid economic conditions, insatiable buyers of junk sent the Bloomberg Barclays Corporate high yield spread to the lowest since before the financial crisis, dropping as low as 303bps, the tightest level since late 2007 before drifting somewhat wider during the late week bond rout.
As US junk bonds have remained surprisingly resilient in the face of last week’s rate rout, even as investment grade spreads have continued to drift wider resulting in a , questions have started to emerge about just how much longer this high yield complacency can sustain.


Leave A Comment