
Context plays a vital role in the development of reliable market forecasts. Short-term price behavior only has meaning when analyzed in the proper context afforded by the long-term view, so all investing and trading strategies should begin with a thorough understanding of the big picture. The cyclical bull market in stocks that began in early 2009 has developed into the largest and most speculative bubble of the past 100 years. Further, at a current duration of more than eight years, the latest cyclical top is long overdue and it could form at any time.

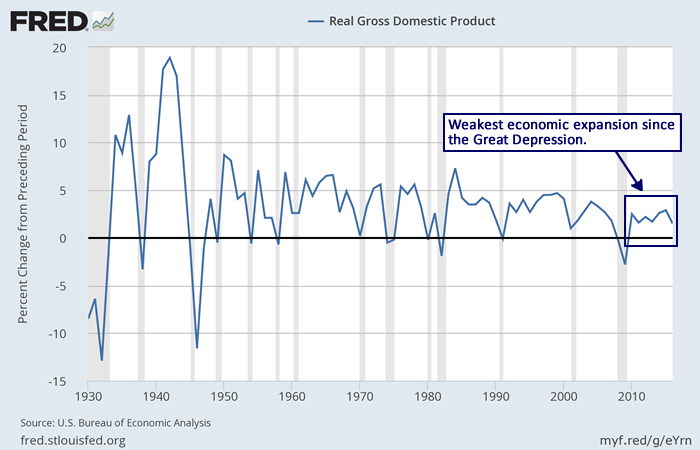
In terms of real GDP growth, the current economic expansion has been the weakest since the Great Depression.
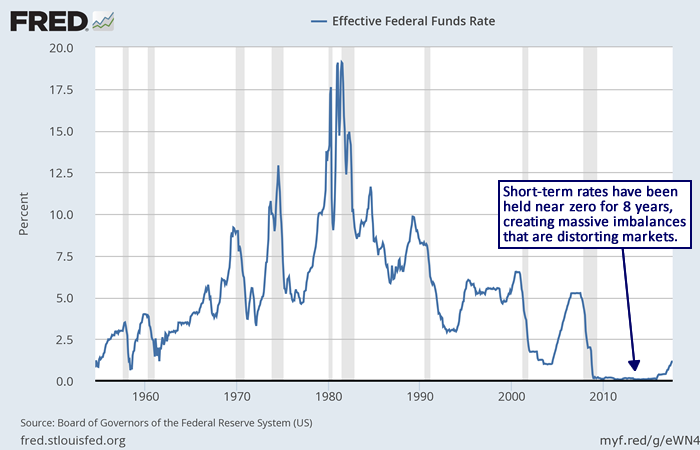
If economic growth has been so poor during the past eight years, why has the stock market experienced such a strong advance during that time? Why is the S&P 500 index up a staggering 263% from the low in March 2009? Those gains have been fueled primarily by the Federal Reserve and its reckless stimulus policies that have targeted risk assets such as stocks. By holding short-term interest rates near zero for eight years, the Federal Reserve has encouraged malinvestment and speculation while punishing saving, in the process creating massive market distortions and imbalances.
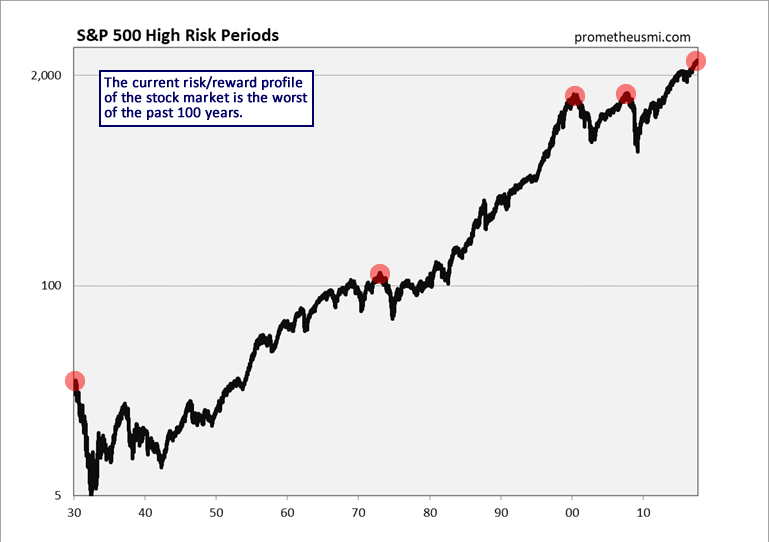
As a result, the current risk/reward profile of the stock market from an investment perspective is at the highest level of the past 100 years, surpassing even the 1929 and 2000 bubble peaks.
The current P/E ratio of the S&P 500 index is 25 and it is priced to deliver slightly negative annual returns during the coming decade. Think about that. The stock market will likely be at or below current levels ten years from now. That is because there is always a cost for manipulating markets to this degree, and, in this case, the cost will ultimately prove to be severe. In essence, the Federal Reserve has pulled future gains into the present, setting the stage for many years of extremely poor performance.
Of course, because bubbles are highly irrational by nature, predicting the timing of their demise with any useful degree of statistical confidence is difficult. However, careful analysis of market data can indicate when a bubble is on the verge of collapse. Our computer models monitor a large basket of data that have, historically, provided reliable signals with respect to long-term direction, and right now several indicators suggest that the current bubble is vulnerable. For example, our cyclical trend scores for valuation, price oscillator, and sentiment are all near bearish extremes.


Leave A Comment