
We all tend to understand the concept of productivity as it is used in a business setting.
Business productivity is a measure of the efficiency of an organization. That is, in this context productivity represents the ability of a firm to manage its resources as well as possible to produce profitable goods or services. In other words, business productivity indicates how well a firm is really doing.
At the economy level, there is also a productivity measure which provides a rough gauge of how well the economy is performing.
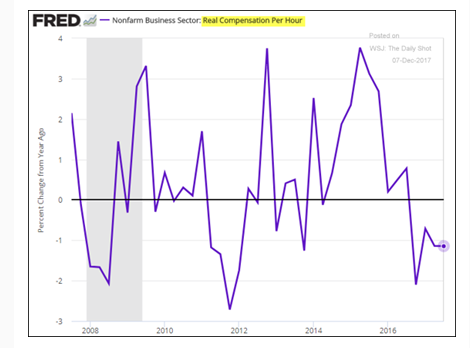
Productivity (or output per employed worker) in the U.S. has been improving, albeit very slowly compared to the previous decades. This is one of the principal causes behind the fact that real wages have been almost flat over the last two decades.
Despite the American economy being nearly fully employed, slower productivity growth is also associated with weaker GDP growth as well as a deceleration in the average standard of living.
Of course, the longer-term slowdown in the labor force growth to less than a 1% annual pace also contributes to slower GDP growth. But a slower growing labor force should not on its own explain poorer productivity.
The growing income inequality problem is also directly tied to the weaker productivity growth trends. Indeed, it remains one of the significant public policy challenges of this era, why the nearly fully employed economy is providing such meagre real wage returns for the bulk of the American workers?
The following three charts highlight current trends in business productivity (output per hour), the shrinkage in the wage share of national income (index) to near record lows, and the decline in real compensation per hour in recent years.


Leave A Comment